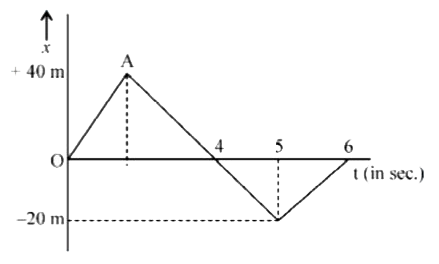
Figure shows the graph of x-coordinate of a particle moving along x-axis as a function of time. Average velocity during t = 0 to 4 s and instantaneous velocity at t = 4.113 s respectively will be
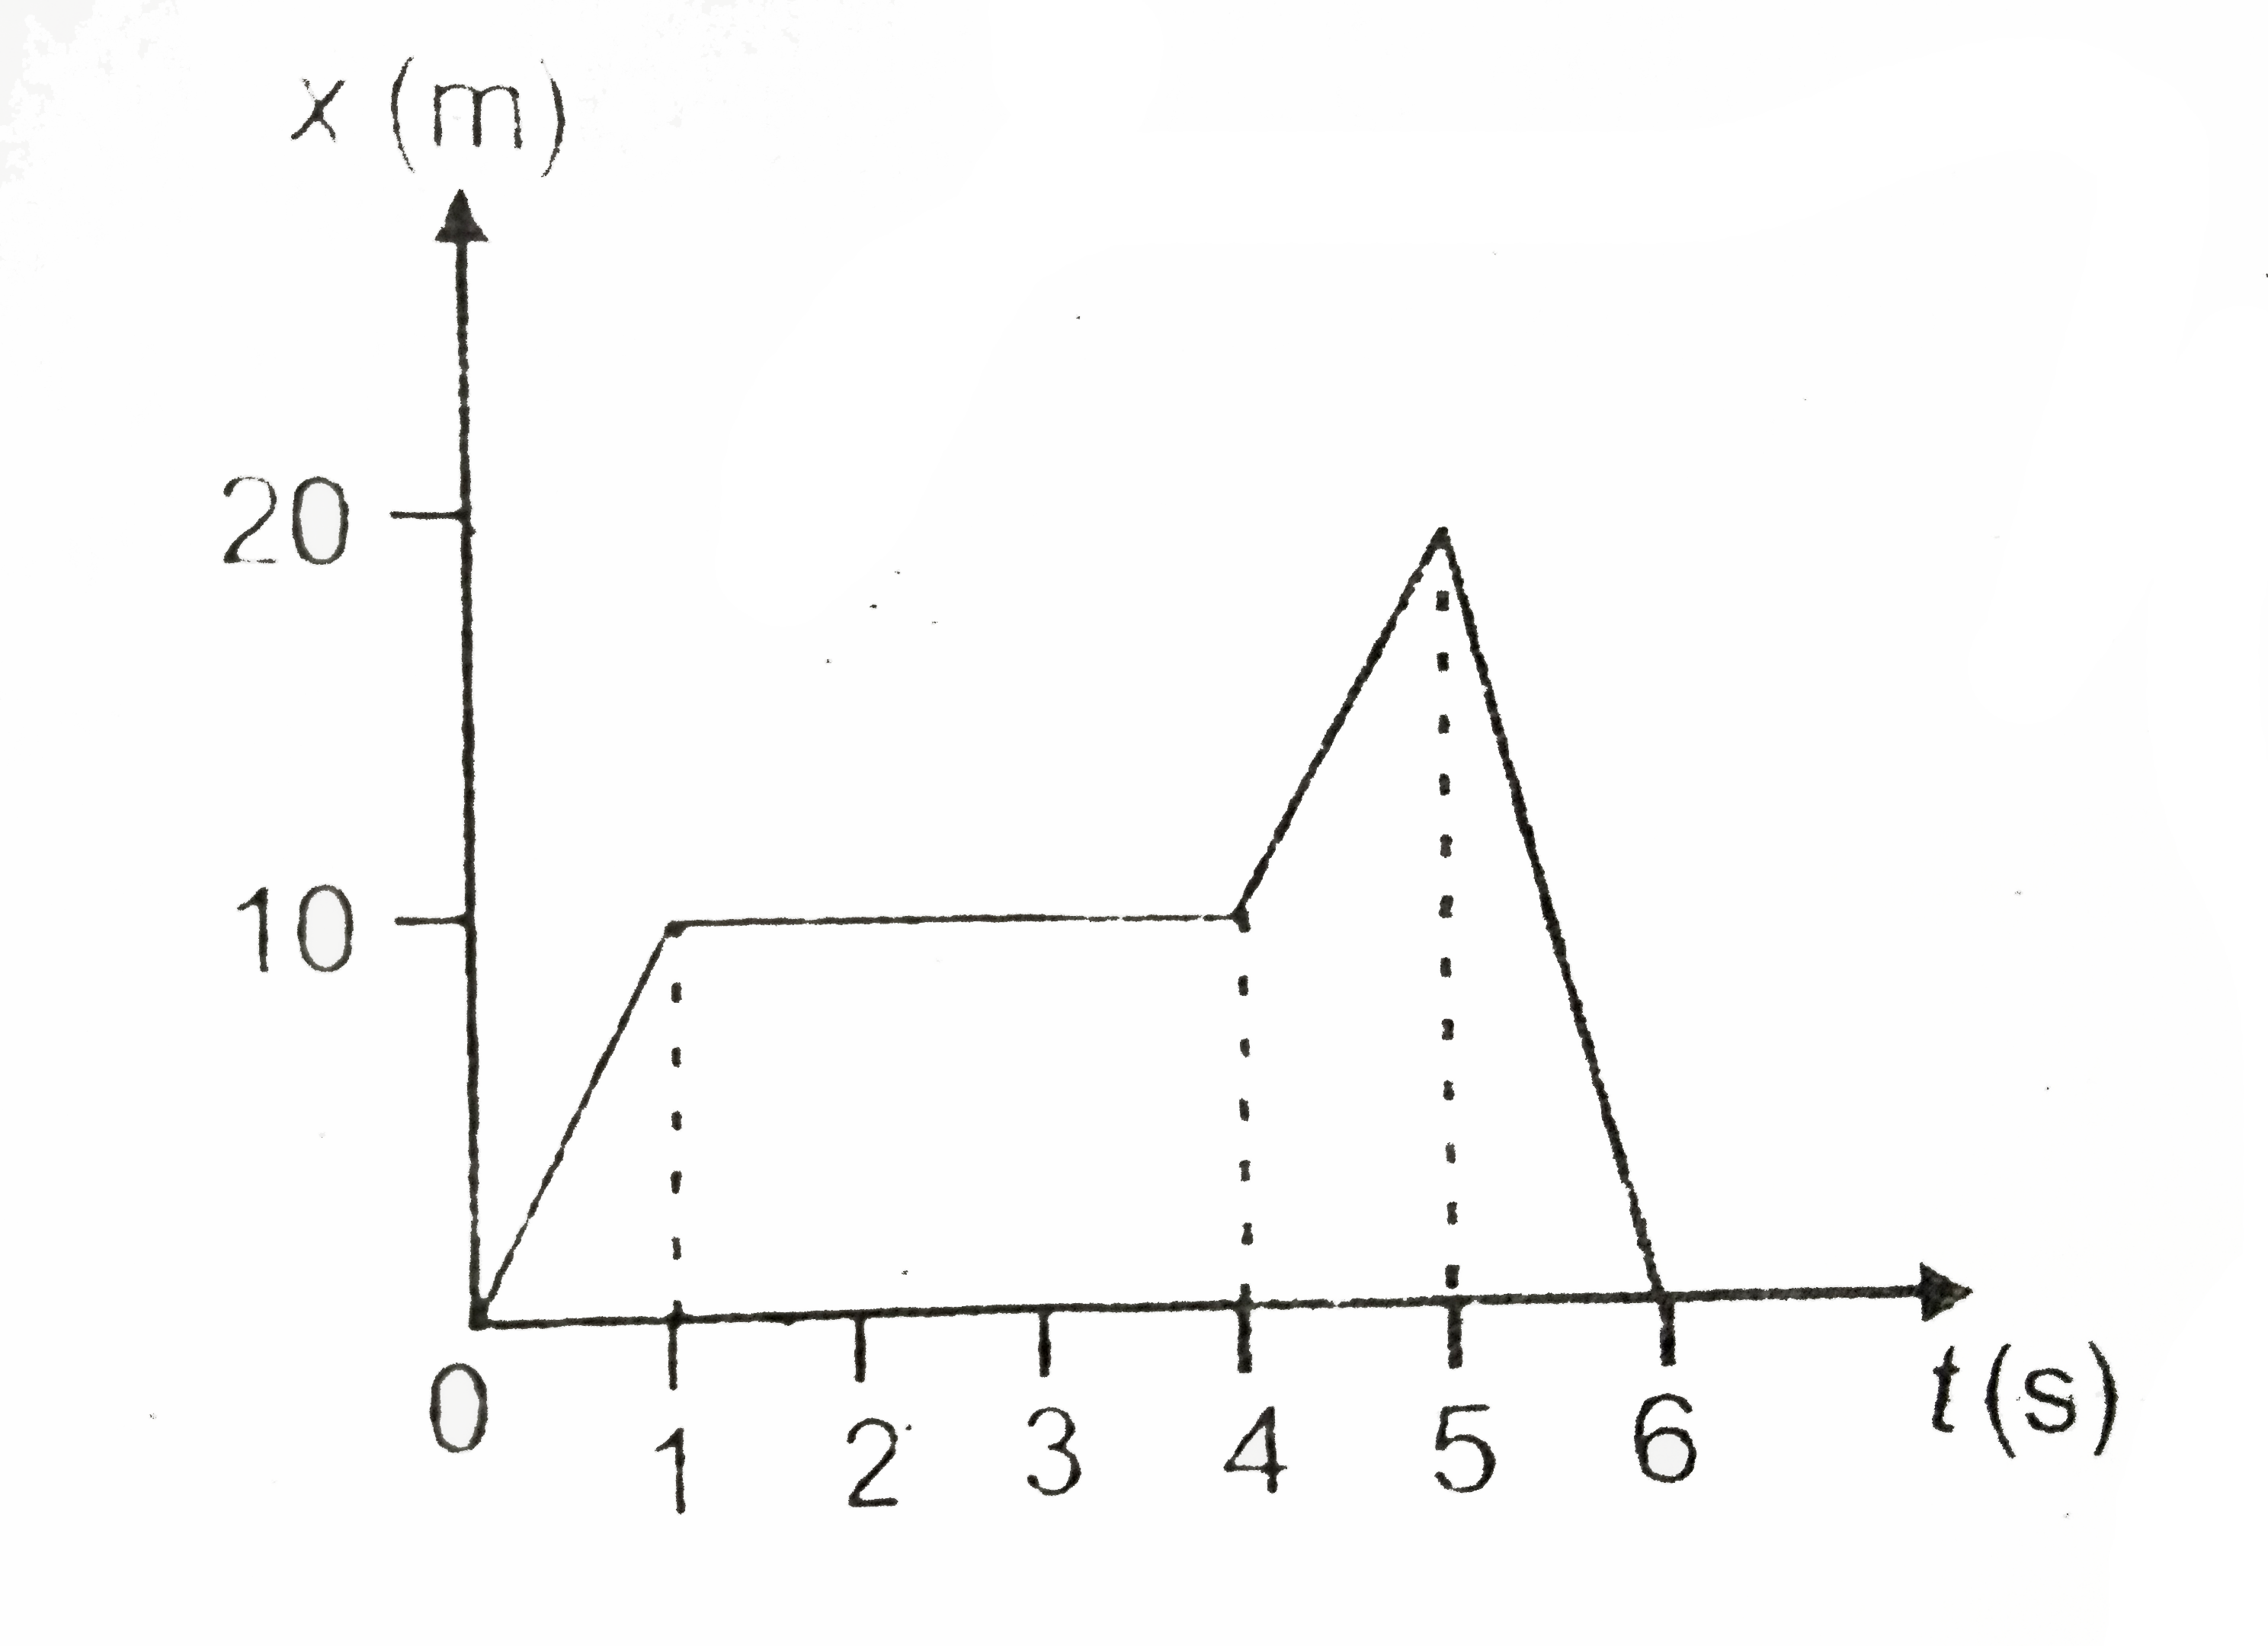
5 m/s, 10 m/s
2.5 m/s, 10 m/s
Zero, zero
10 m/s, 2.5 m/s
The correct Answer is:B
Step by step video & image solution for Figure shows the graph of x-coordinate of a particle moving along x-axis as a function of time. Average velocity during t = 0 to 4 s and instantaneous velocity at t = 4.113 s respectively will be by Physics experts to help you in doubts & scoring excellent marks in Class 12 exams.
Updated on:21/07/2023Topper's Solved these Questions
- MOTION IN STRAIGHT LINEBook:AAKASH INSTITUTE ENGLISHChapter:MOTION IN STRAIGHT LINEExercise:Assignment (SECTION - C)
Explore 7 Videos
- MOTION IN STRAIGHT LINEBook:AAKASH INSTITUTE ENGLISHChapter:MOTION IN STRAIGHT LINEExercise:Assignment (SECTION - D)
Explore 24 Videos
- MOTION IN STRAIGHT LINEBook:AAKASH INSTITUTE ENGLISHChapter:MOTION IN STRAIGHT LINEExercise:Assignment (SECTION - A)
Explore 50 Videos
- MOTION IN A STRAIGHT LINEBook:AAKASH INSTITUTE ENGLISHChapter:MOTION IN A STRAIGHT LINEExercise:ASSIGNMENT (SECTION - D)
Explore 15 Videos
- MOVING CHARGE AND MAGNESIUMBook:AAKASH INSTITUTE ENGLISHChapter:MOVING CHARGE AND MAGNESIUMExercise:SECTION D
Explore 16 Videos
Similar Questions
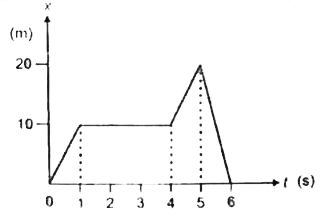
Figure shows the graph of x - coordinate of a particle moving along x - axis as a function of time. Average velocity during t = 0 to 6 s and instantaneous velocity at t = 3 s respectively, will be
View SolutionFigure shows the graph of the x-coordinaste of a particle going along the X-axis as a function of time.Find a. te average velocity during 0 to 10s, b. instantaneous velocity at 2,5,8 and 12s.
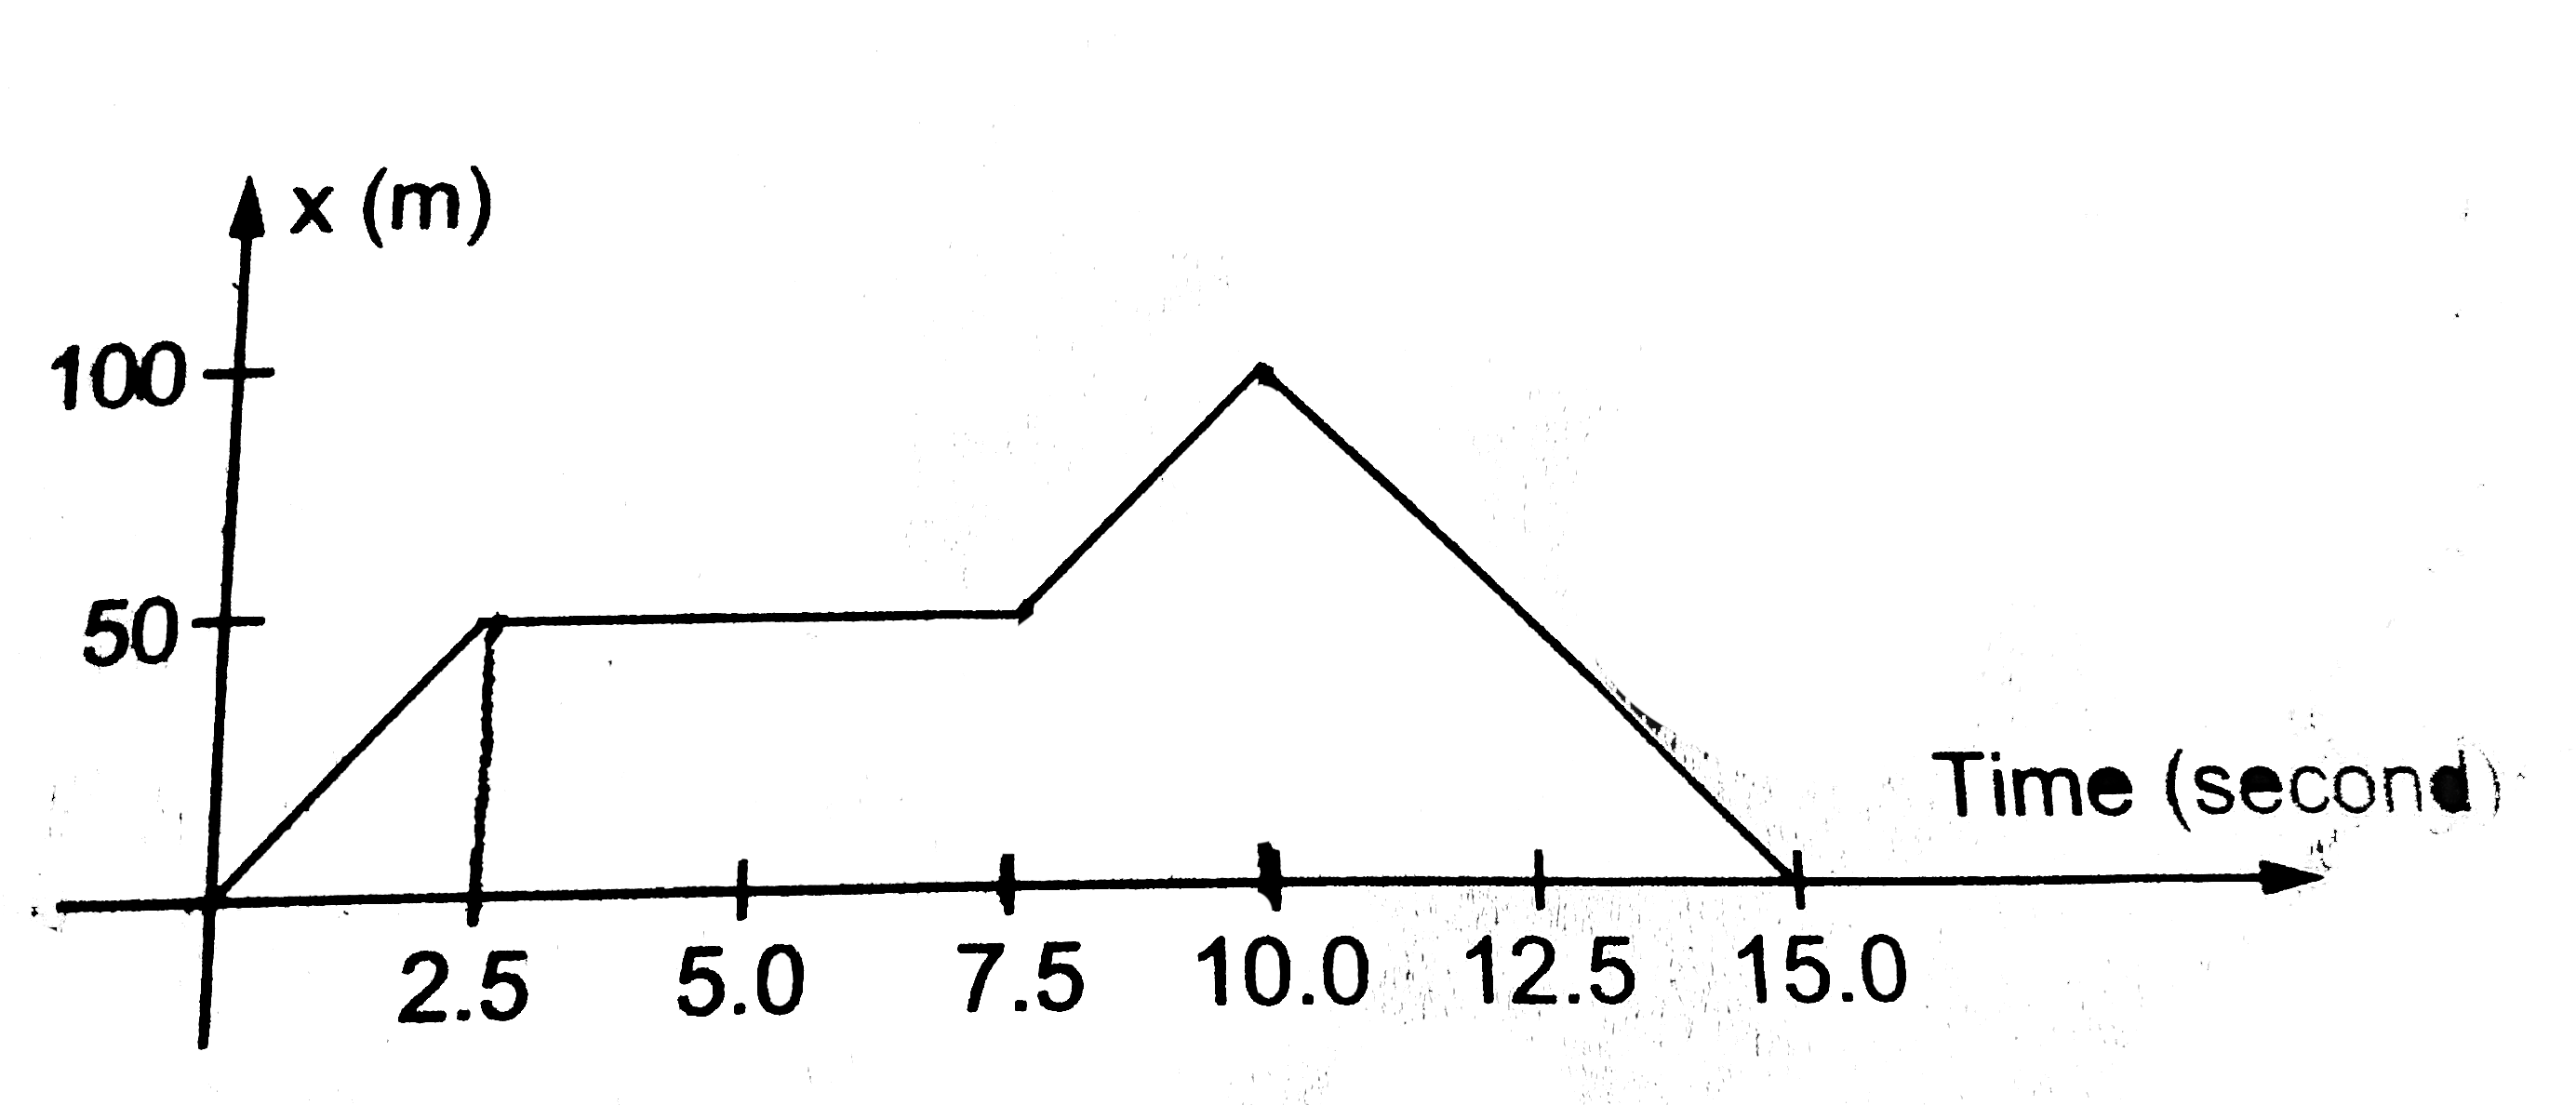
View SolutionFig. shows the graph of the x-coordinate of a particle going along the x-axis as a function of time. Find (a) the average velocity during 0 to 10s, (b) instantaneous velocity at 2, 5, 8 and 12s.
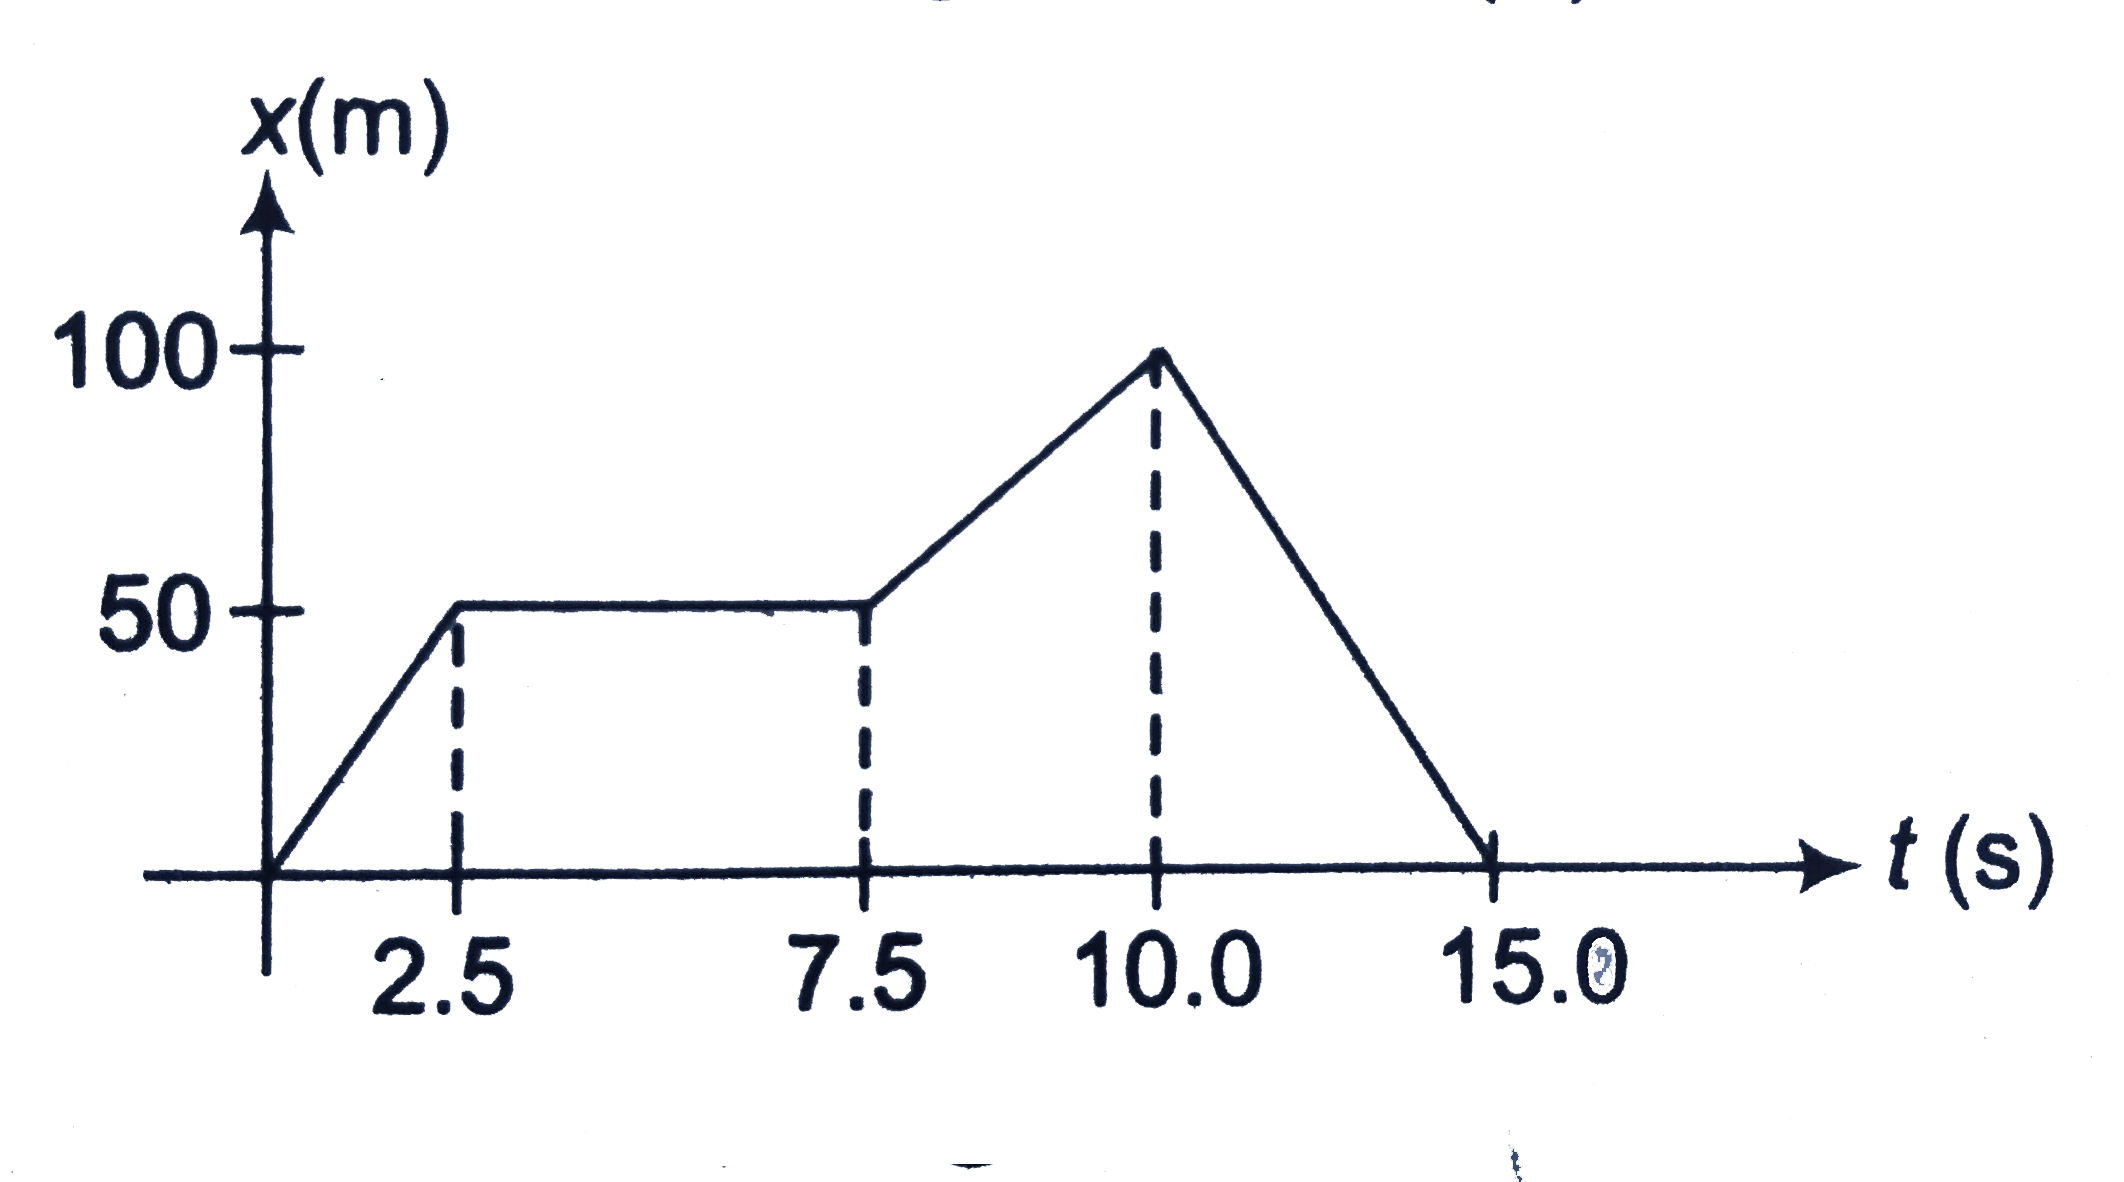
View Solutions-t graph of a particle in motion is shown in Fig. Calculate Average velocity
View SolutionFigure shows x-t graph of a particle. Find the Time T such that the average velocity of the particle during the period 0 to T is Zero.

View SolutionFigure shows the velocity time graph of a particle moving along straight line (v is m/s and t is in second). It average velocity in 20 seconds will be:
 .
.
View SolutionPosition-time graph for a particle moving along x− direction is as shown in the figure. Average speed of the particle from t=0 to t=4 is :

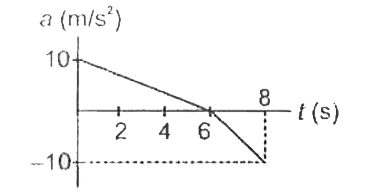
View SolutionThe acceleration - time graph for a particle moving along x - axis is shown in figure, If the initial velocity of particle is −5m/s, the velocity at t = 8 s is
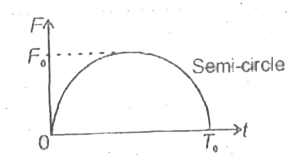
View SolutionThe magnitude of force acting on a particle moving along x-axis varies with time (t) as shown in figure. If at t = 0 the velocity of particle is v0, then its velocity at t=T0 will be
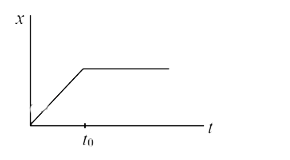
View SolutionFigure shows the position-time graph of a particle moving on the X--axis. Which of these option correctly describes the particle 's motion?
View Solution
