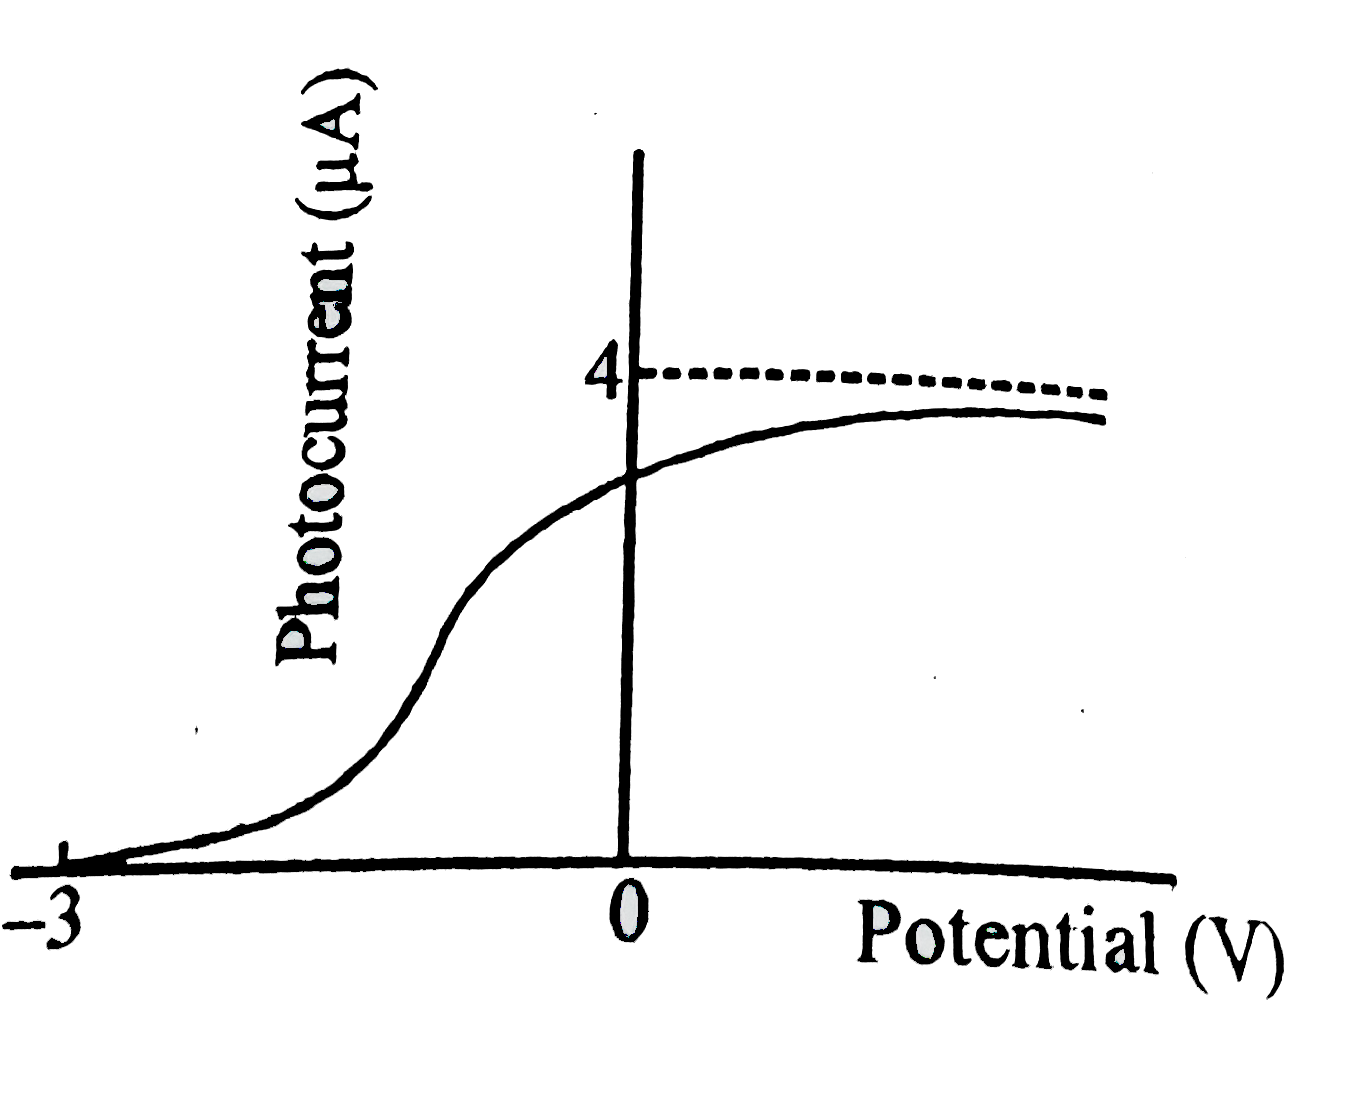
Figure shows the graph of photocurrent versus potential of the anode with respect to the cathode.The intensity of the incident radiation is halved and freqency doubled. The stopping potential and the saturation current will now be respectively.
−6.0V and 2.0μA-
−6.0V and 4.0μA
−6.0V and 1.0μA
None of these
The correct Answer is:D
dNdt=IAhf=14dN0dt
vs=hfe−ϕe
3=hfe−ϕe
v'=2hfe−ϕe=2×3+ϕe=6+ϕe>6
Topper's Solved these Questions
- TEST PAPERSBOOK - BANSALCHAPTER - TEST PAPERSEXERCISE - CHEMISTRY
133 Videos
- TEST PAPERSBOOK - BANSALCHAPTER - TEST PAPERSEXERCISE - MATHEMATICS
58 Videos
- TEST PAPERSBOOK - BANSALCHAPTER - TEST PAPERSEXERCISE - MATHS SECTION - 2 [MULTIPLE CORRECT CHOICE TYPE]
6 Videos
- PROBABILITYBOOK - BANSALCHAPTER - PROBABILITYEXERCISE - All Questions
1 Videos
- THERMODYNAMICSBOOK - BANSALCHAPTER - THERMODYNAMICSEXERCISE - Match the column
7 Videos
Similar Questions
Knowledge Check
For the graph of collector plate potential versus photoelectric current is as shown in the figure if I denotes intensity of incident radiation then
 AIA>IB>ICBIA<IB<i−CCIA=IB=ICDIB>IAandIB<IC
Which of the following is the graph between the frequency (v) of the incident radiations and the stopping potential ?
A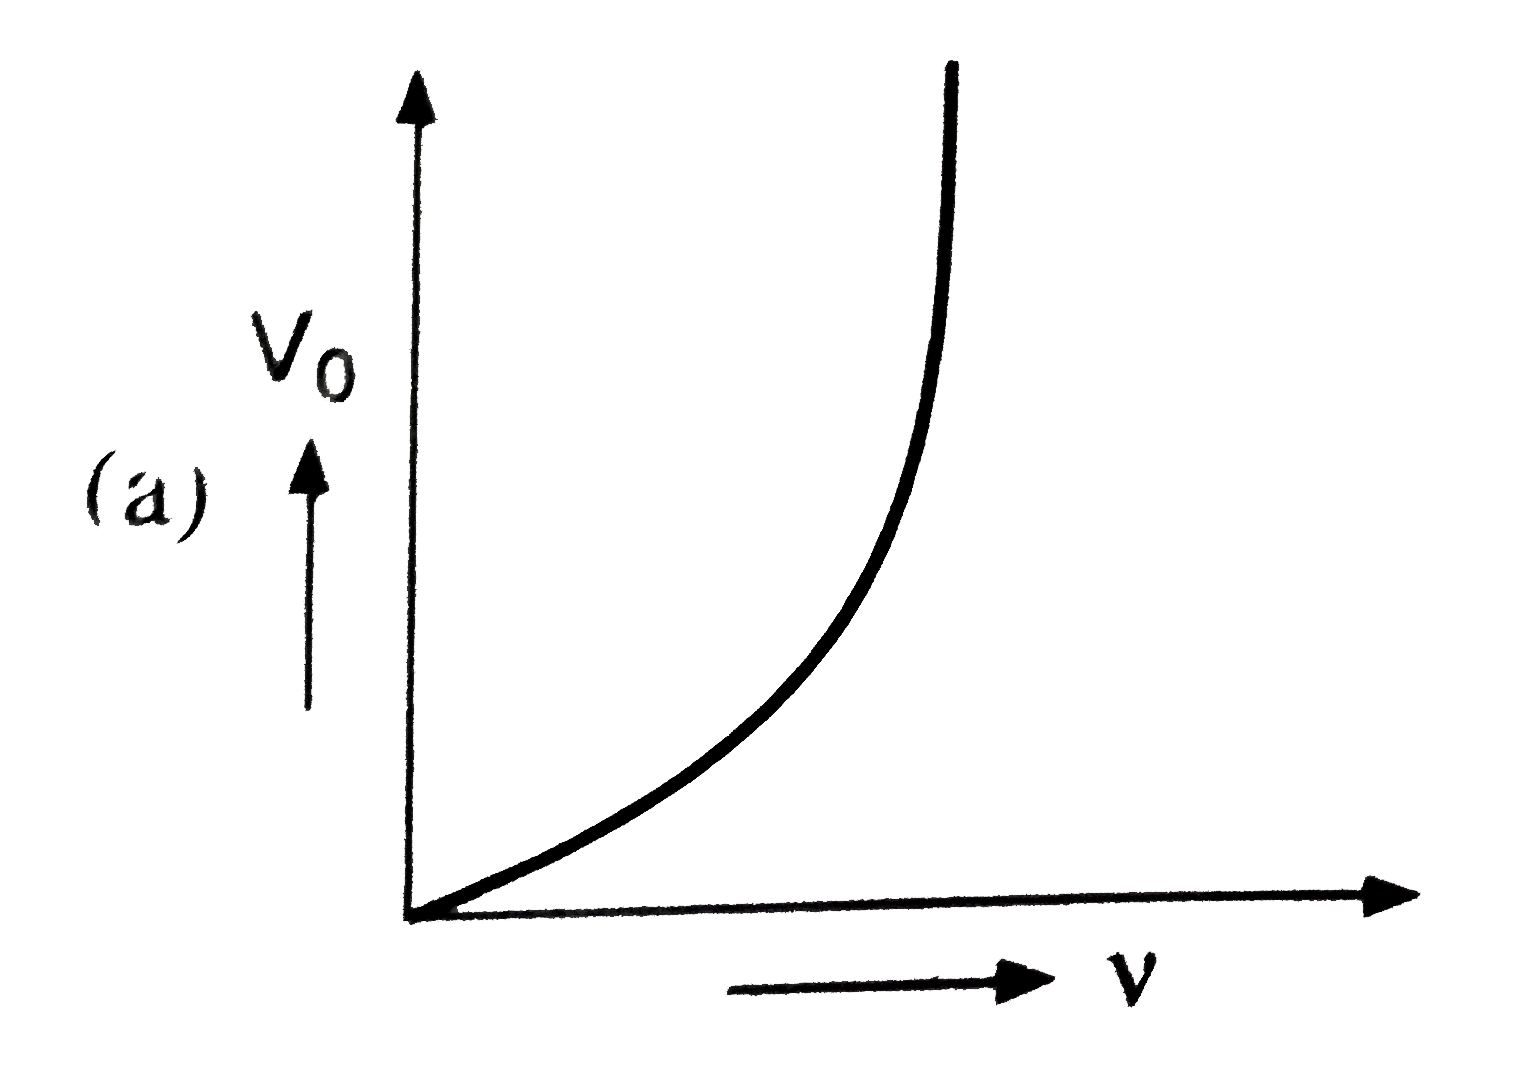 B
B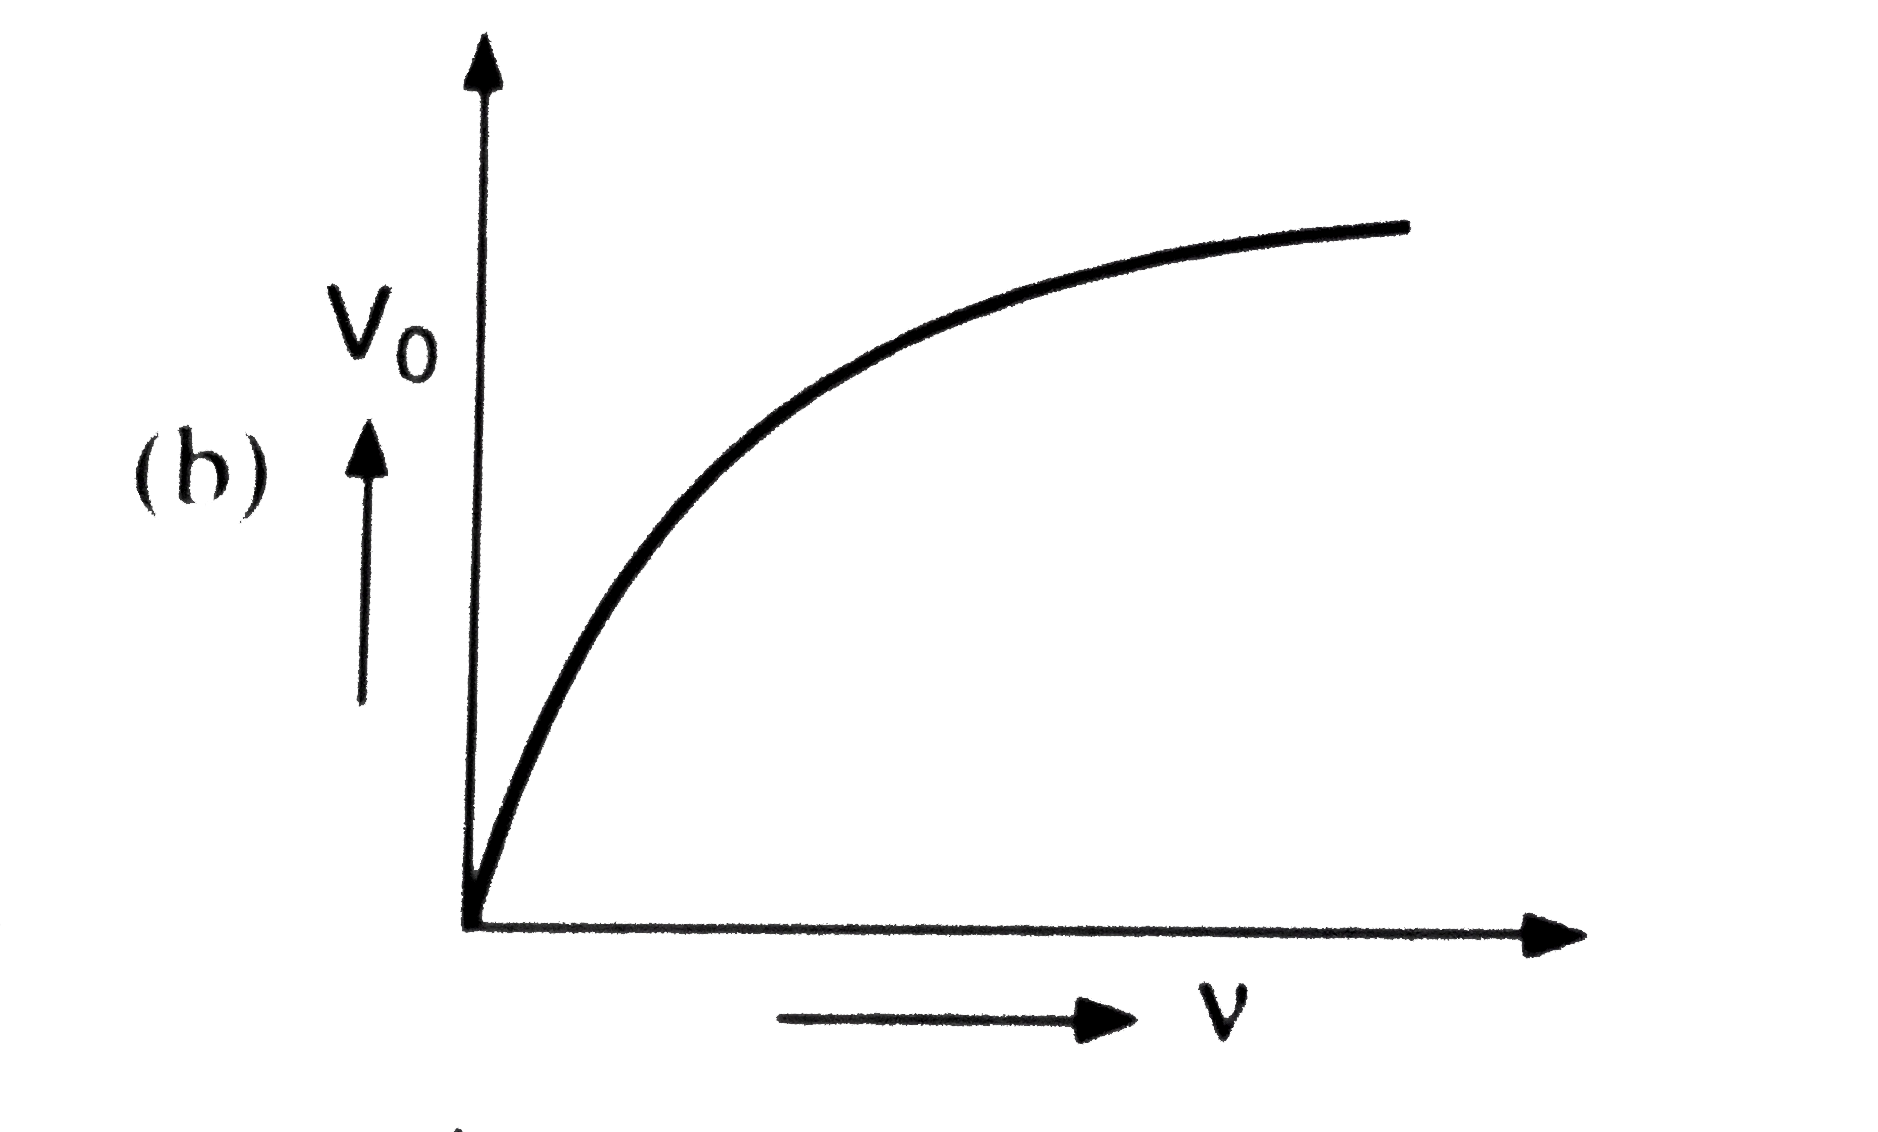 C
C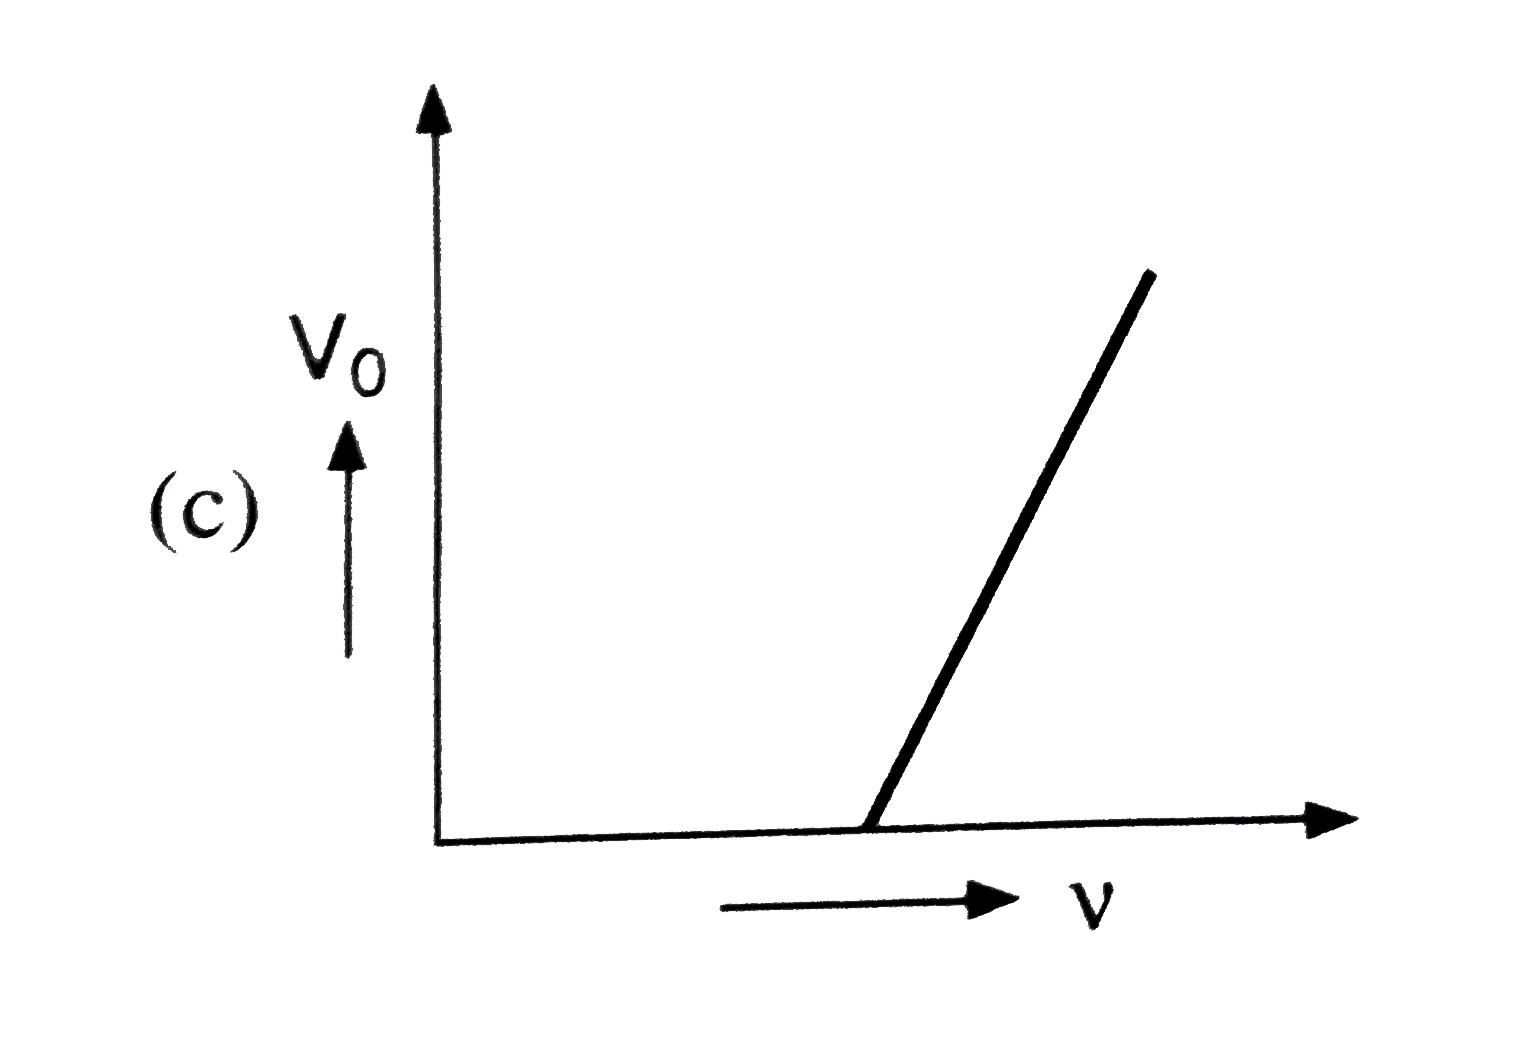 D
D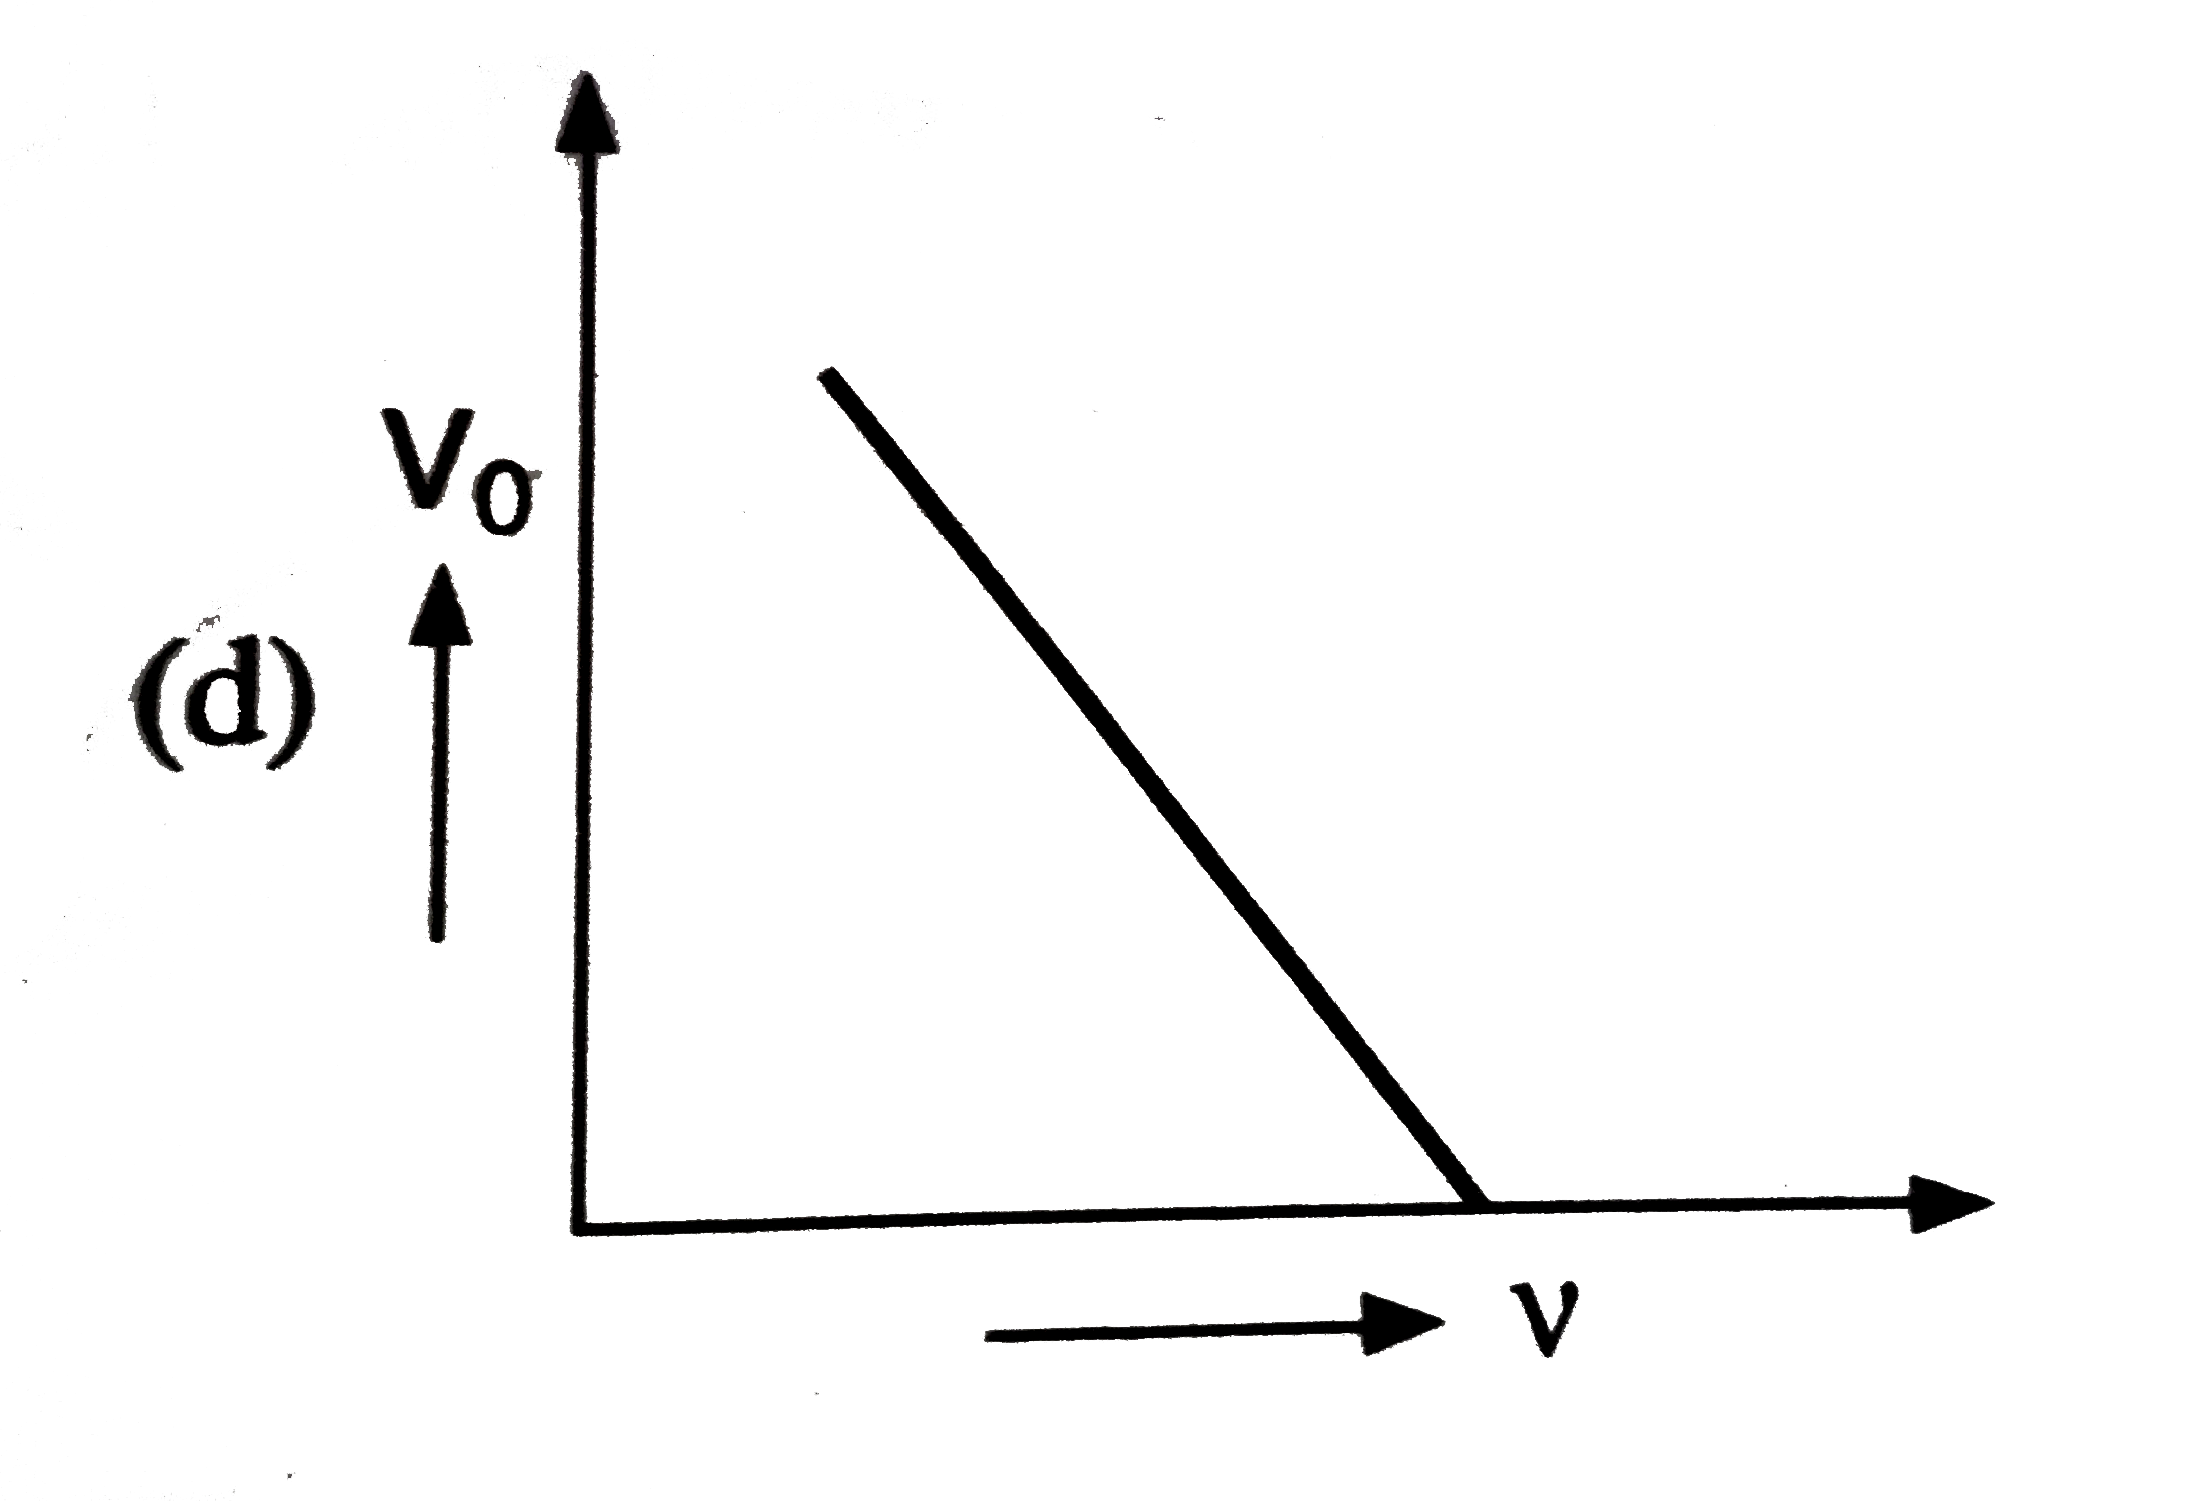
Stopping Potential||Saturation Current Graphs
View SolutionIntensity and frequency of incident light both are doubled.
Then, what is the effect on stopping potential and saturation current.
View SolutionIntensity and frequency of incident light both are doubled.
Then, what is the effect on stopping potential and saturation current.
View SolutionDoes the 'stopping potential' in photoelectric emission depend upon
(i) the intensity of the incident radiation in a photocell. ?
(ii) The frequency of the incident radiation ?
View SolutionDoes the stopping potential in photoelectric emission depend upon the intensity of the incident radiation in a photo cell? Comment on it.
View Solution(i) In a plot of photoelectric current versus anode potential, how does
(a) the saturation current vary with anode potential for incident radiations of different frequencies but same intensity ?
(b) The stopping potential vary for incident radiations of different intensities but same frequency ?
(c) photoelectric current vary for different intensities but same frequency of incident radiations ?
Justify your answer in each case.
(ii) The work function of caesium is 2.14 eV. find (a) the threshold frequency for caesium, and
(b) The wavelength of the incident light if the photocurrent is brought to zero by a stopping potential of 0.60 V.
View Solution
