Draw a chart showing the classification of Business Activities.
Step by step video & image solution for Draw a chart showing the classification of Business Activities. by Business Studies experts to help you in doubts & scoring excellent marks in Class 11 exams.
Updated on:21/07/2023Topper's Solved these Questions
- PART-A FOUNDATIONS OF BUSINESS BOOK - SUBHASH DEYCHAPTER - PART-A FOUNDATIONS OF BUSINESS EXERCISE - Long ans
6 Videos
- PART-A FOUNDATIONS OF BUSINESS BOOK - SUBHASH DEYCHAPTER - PART-A FOUNDATIONS OF BUSINESS EXERCISE - Very short
10 Videos
- PART-A FOUNDATIONS OF BUSINESS BOOK - SUBHASH DEYCHAPTER - PART-A FOUNDATIONS OF BUSINESS EXERCISE - Multiple
7 Videos
- INTERNATIONALBOOK - SUBHASH DEYCHAPTER - INTERNATIONALEXERCISE - Shot ans.
8 Videos
- PRIVATE , PUBLIC AND GLOBAL ENTERPRISESBOOK - SUBHASH DEYCHAPTER - PRIVATE , PUBLIC AND GLOBAL ENTERPRISESEXERCISE - TEST YOURSELF Long Answer Type Questions
4 Videos
Similar Questions
Explain in detail the classification of Business Activities on the basis of their function.
View Solution(a) Name the structural and functional unit of nervous system.
(b) Draw a flow chart to show the classification of nervous system into various parts.
(c) What is autonomic nervous system? What is its function?
View Solution
Knowledge Check
KPO is specialised in which type of Business activities .
A(a) Highly specialisedB(b) RoutineC(c) Software development onlyD(d) None of these
Draw a flow chart showing classification of kingdom Plantae.
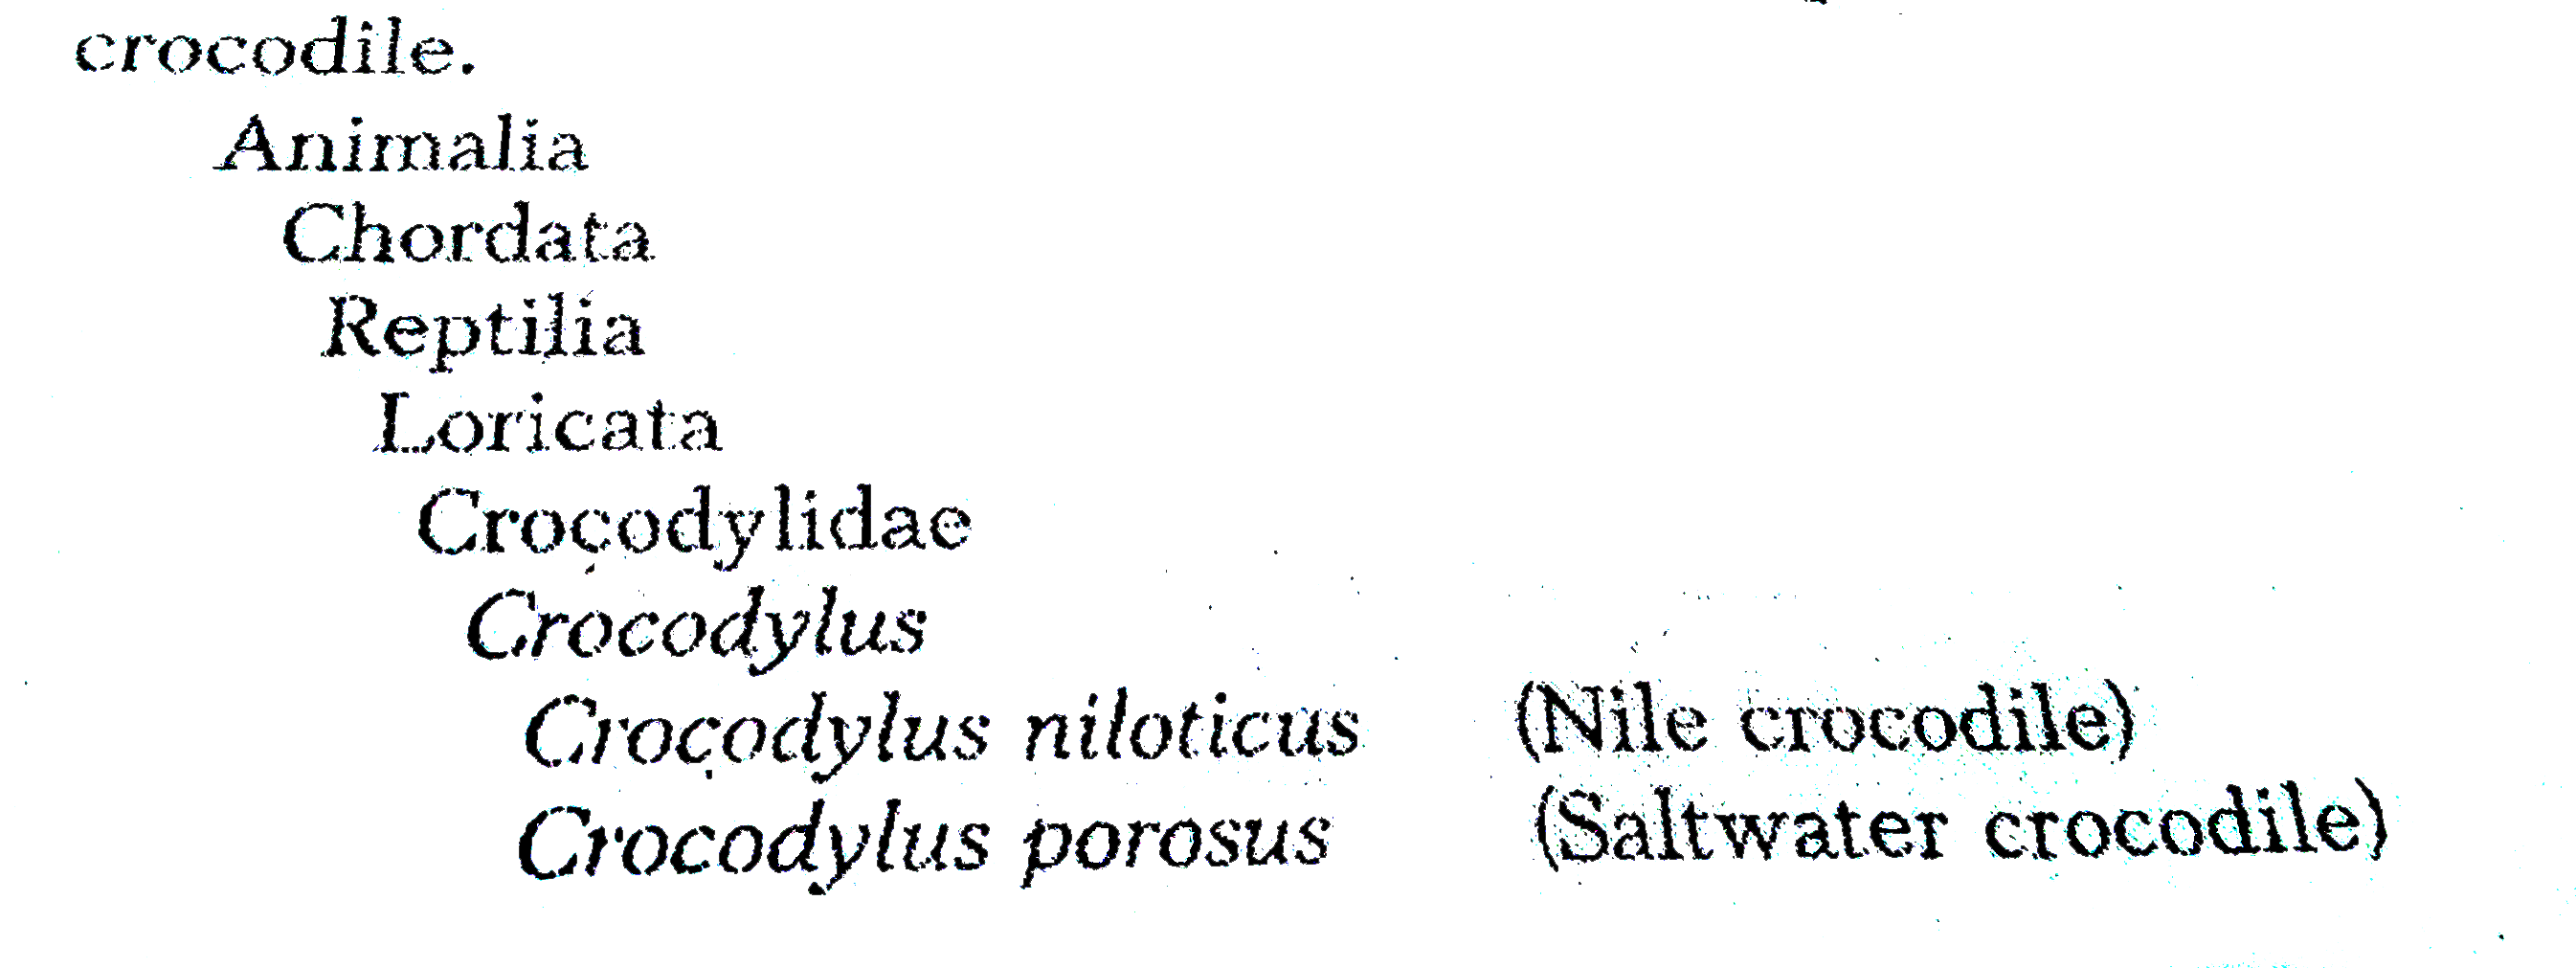
View SolutionThe chart shows the classification of two species of crocodile.

To which order do these crocodiles belong?
View SolutionDraw a graph showing the variation of decay rate with number of active nuclei.
View SolutionDraw a graph showing the variation of decay rate with number of active nuclei.
View SolutionDraw a flow chart to depict the multiplication of an HIV virus in a host cell.
View SolutionMake a table to show the classification of modern Indian languages.
View SolutionDraw a pie chart showing the following information. The table shows the colours preferred by a group of people. Colours Nubers of people Blue 18, Green 9, Red 6, Yellow 3, and Tatal 36
View Solution
