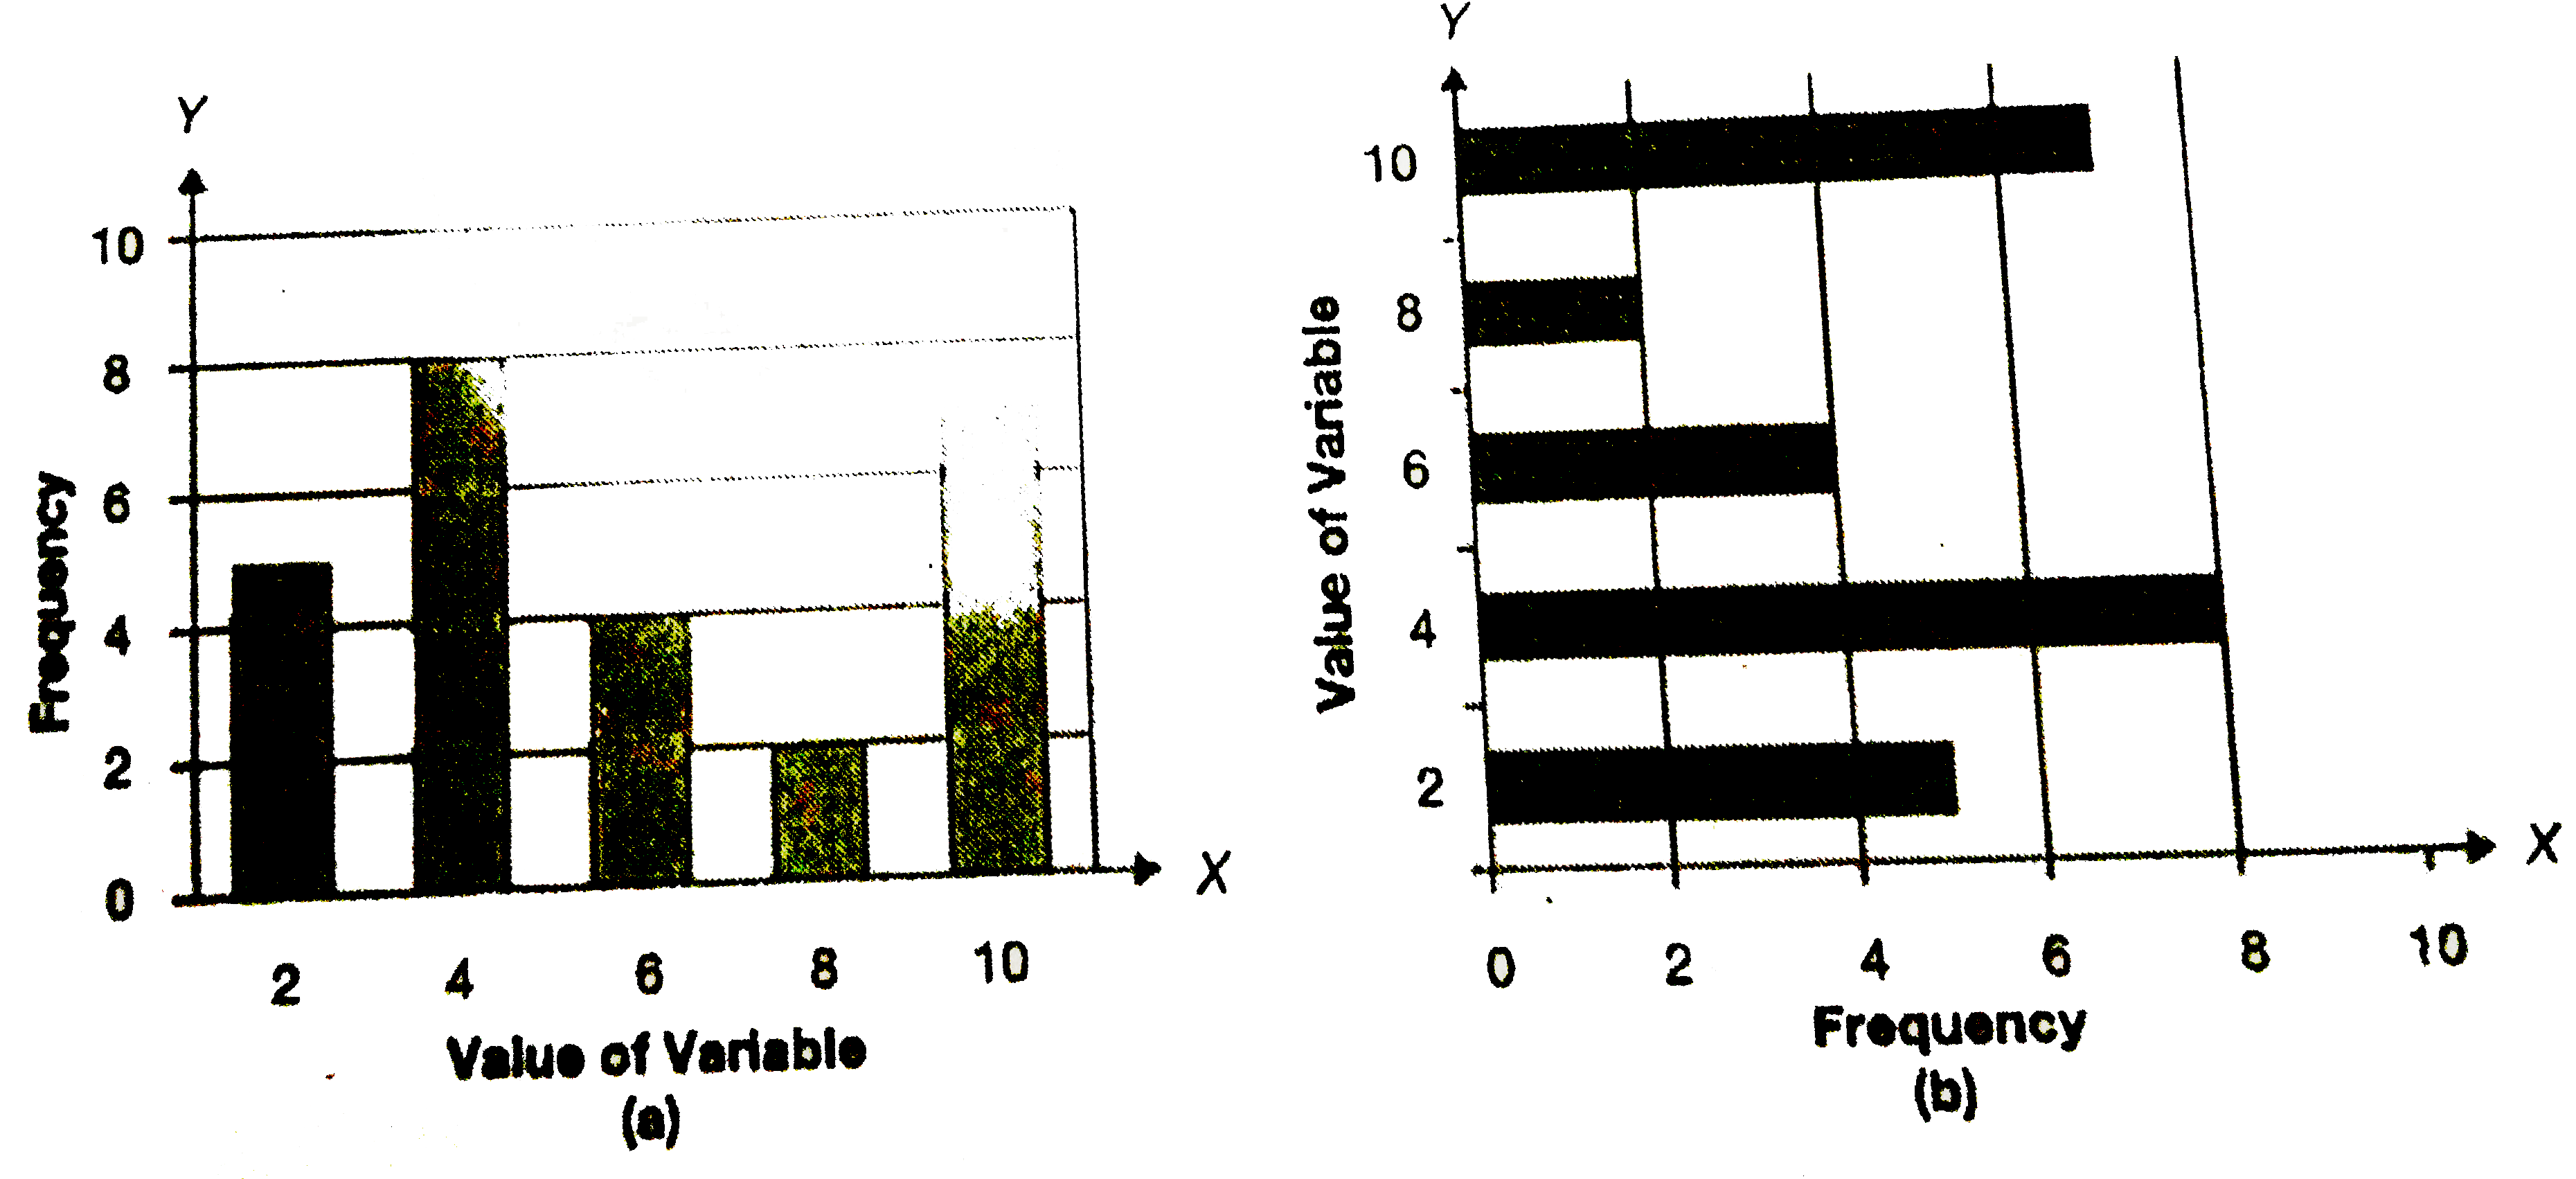
Represent the following frequency distribution by a bar graph :

Either of the following bar graphs may be used to represent the above frequency distribution .
The first graph takes value of the variable along the X-axis and the frequency along the Y-axis , whereas the second one takes the frequency along the X-axis and the value of the variable on the Y-axis .
All the rectangles (i.e., bars ) should be of same width and uniform spaces should be left between any two consecutive bars .

Topper's Solved these Questions
- BOOK - PEARSON IIT JEE FOUNDATIONCHAPTER - STATISTICS EXERCISE - Very short answer type questions30videos
STATISTICS
- BOOK - PEARSON IIT JEE FOUNDATIONCHAPTER - STATISTICS EXERCISE - Short Answer Type Questions13videos
STATISTICS
- BOOK - PEARSON IIT JEE FOUNDATIONCHAPTER - SHARES AND DIVIDENDSEXERCISE - Level 315videos
SHARES AND DIVIDENDS
- BOOK - PEARSON IIT JEE FOUNDATIONCHAPTER - TAXATION EXERCISE - LEVEL 310videos
TAXATION
Similar Questions
Represent the following frequency distribution as a bar graph:
 View Solution
Represent the following frequency distribution as a bar graph :
¯¯¯¯¯¯¯¯¯¯¯¯¯¯¯¯¯¯¯¯¯¯¯¯¯¯¯¯¯¯¯¯¯¯¯¯¯¯¯¯¯¯¯¯¯¯¯¯¯¯¯¯¯¯¯¯¯¯¯¯¯¯¯¯¯¯¯¯¯¯¯¯¯¯¯¯Value of Variable (x) 1 3 4 6 7Frequency (F) 4 3 2 5 1––––––––––––––––––––––––––––––––––––––––––––––––––View Solution
Knowledge Check
- Question 1 - Select One
To draw a histogram to represent the following frequency distribution.
Class Interval 5−1010−1515−2525−4545−75
Frequency 6 12 10 8 15
The adjusted frequency for the class 25−45 isA6B5C3D2
Represent the following frequency distribution by bar graph:
Value of Variable3691215Frequency610438View SolutionRepresent the following frequency distribution by means of a histogram.
 View Solution
Depict the following frequency distribution by a histogram.
 View Solution
Draw a histogrum and to represent the following frequency distribution :
View SolutionDraw a histogram and frequency polygen to represent the following frequency distribution :
View SolutionDraw the frequency polygon representing the following frequency distribution
 View Solution
The mean of the following frequency distribution is 50 :
 View Solution

