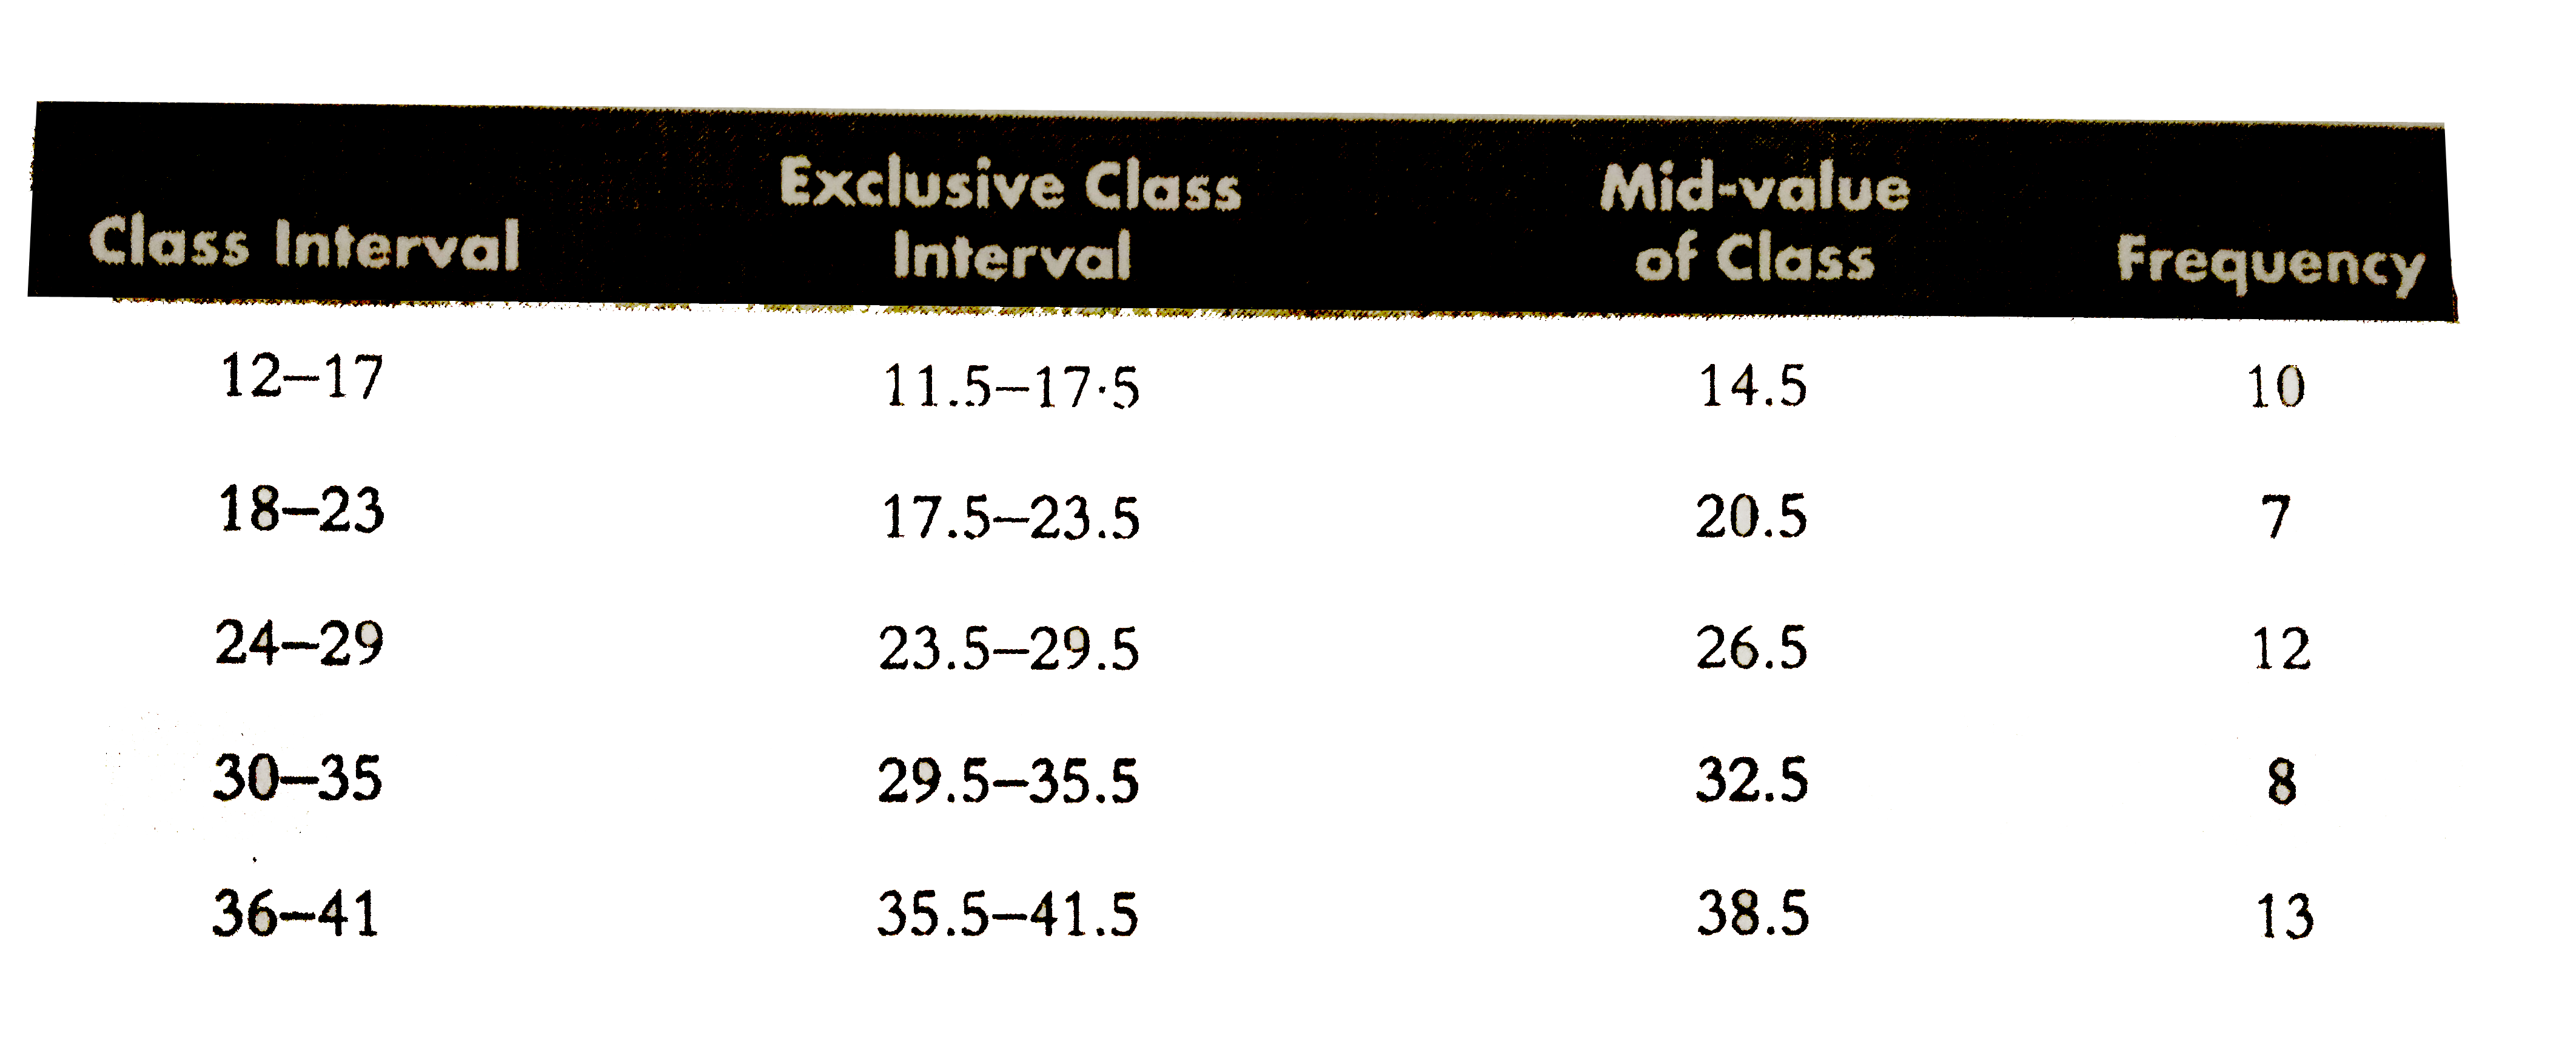
Construct a frequency polygon for the following data :

Here , the class intervals are discontinous ,
Hence , first we convert the class intervals to continous class intervals and then find the mid-points of each class intervals . We do this by adding 0.5 to each upper limit and subtracting 0.5 from each lower limit .

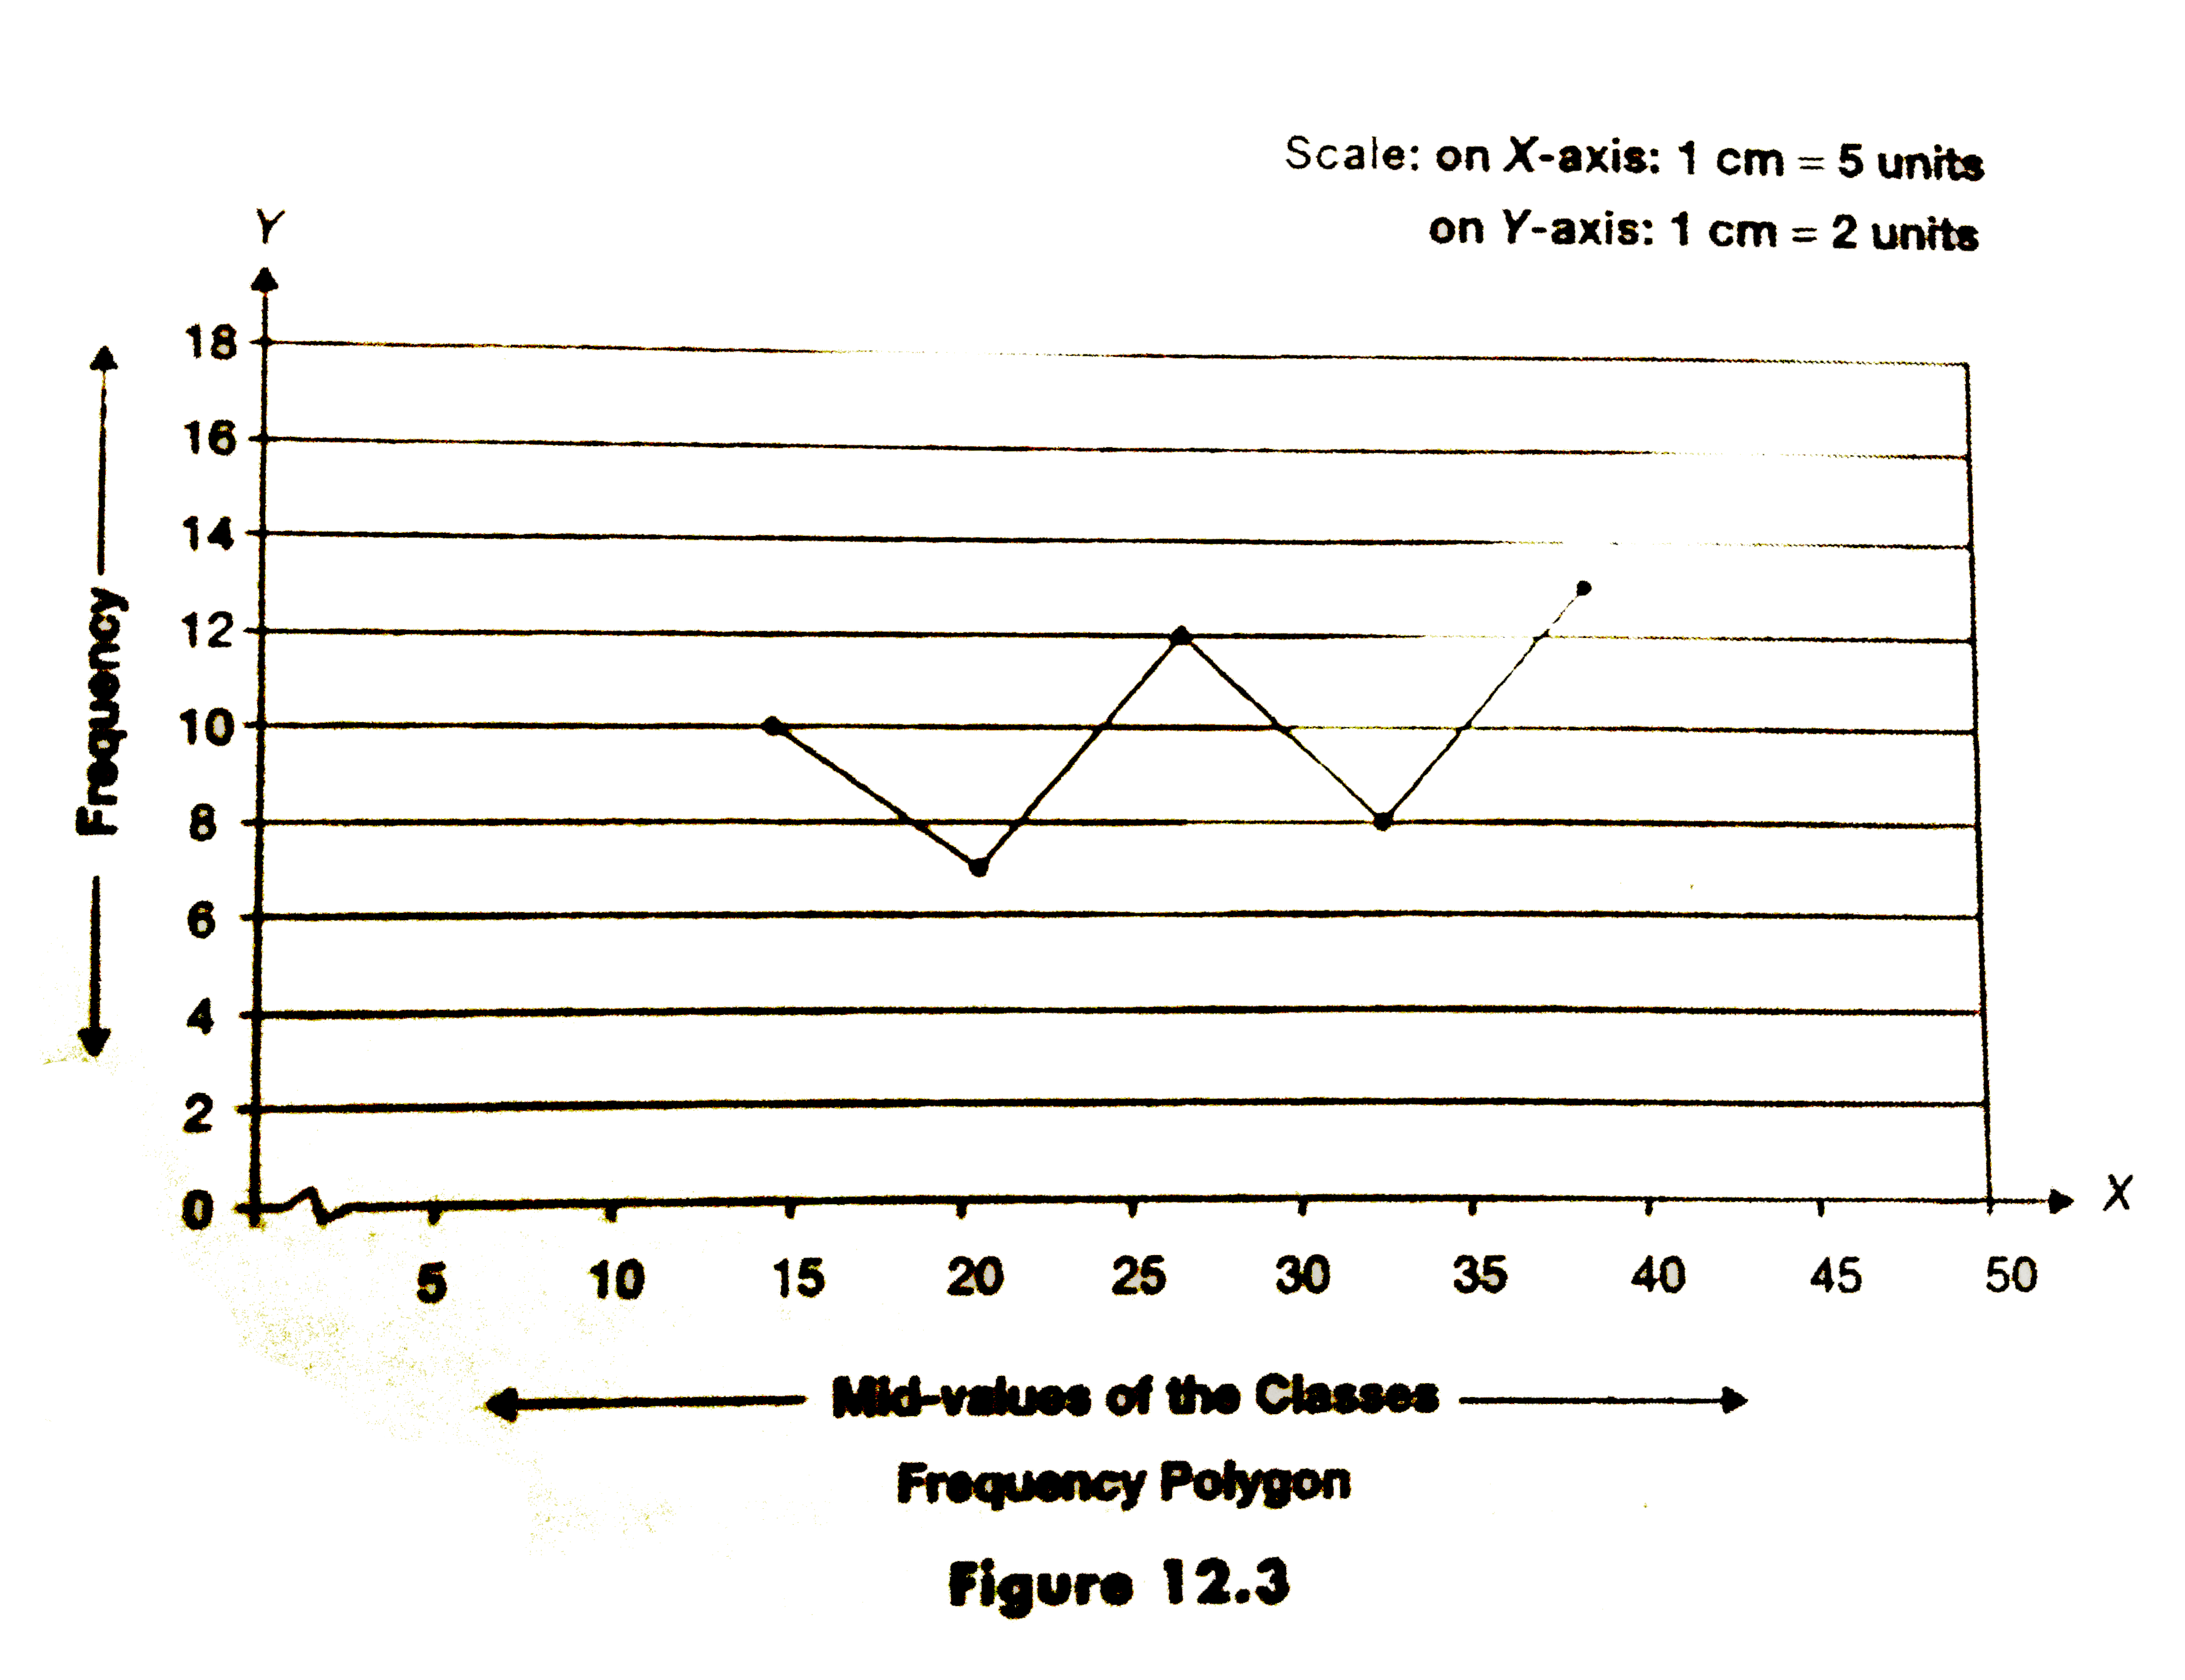
Now , taking the mid-values of class intervals on the X-axis and the corresponding frequencies on the Y-axis , we draw the frequency polygon as shown in the figure .

Topper's Solved these Questions
- STATISTICS BOOK - PEARSON IIT JEE FOUNDATIONCHAPTER - STATISTICS EXERCISE - Very short answer type questions
30 Videos
- STATISTICS BOOK - PEARSON IIT JEE FOUNDATIONCHAPTER - STATISTICS EXERCISE - Short Answer Type Questions
13 Videos
- SHARES AND DIVIDENDSBOOK - PEARSON IIT JEE FOUNDATIONCHAPTER - SHARES AND DIVIDENDSEXERCISE - Level 3
15 Videos
- TAXATION BOOK - PEARSON IIT JEE FOUNDATIONCHAPTER - TAXATION EXERCISE - LEVEL 3
10 Videos
Similar Questions
Construct the frequency polygon for the following data:

View SolutionDraw a frequency polygon from the following data:

View SolutionConstruct a frequency polygon for the following distribution :

View SolutionConstruct a frequency polygon for the following distribution . Using a graph sheet.

View SolutionPrepare histogram and frequency polygon from the following data :

View SolutionDraw a histogram and frequency polygon from the following data:

View SolutionDraw a frequency polygon from the following data by using (i) histogram , and (ii) without using histogram :

View SolutionDraw a frequency polygon from the following data, giving the age of doctors working in C.G.H.S. in a city.

View SolutionDraw a frequency polygon from the following data, giving the age of doctors working in C.GH.S. in a city

View SolutionDraw a frequency polygon from the following data, giving the age of doctors working in C.G.H.S. in a city.

View Solution
