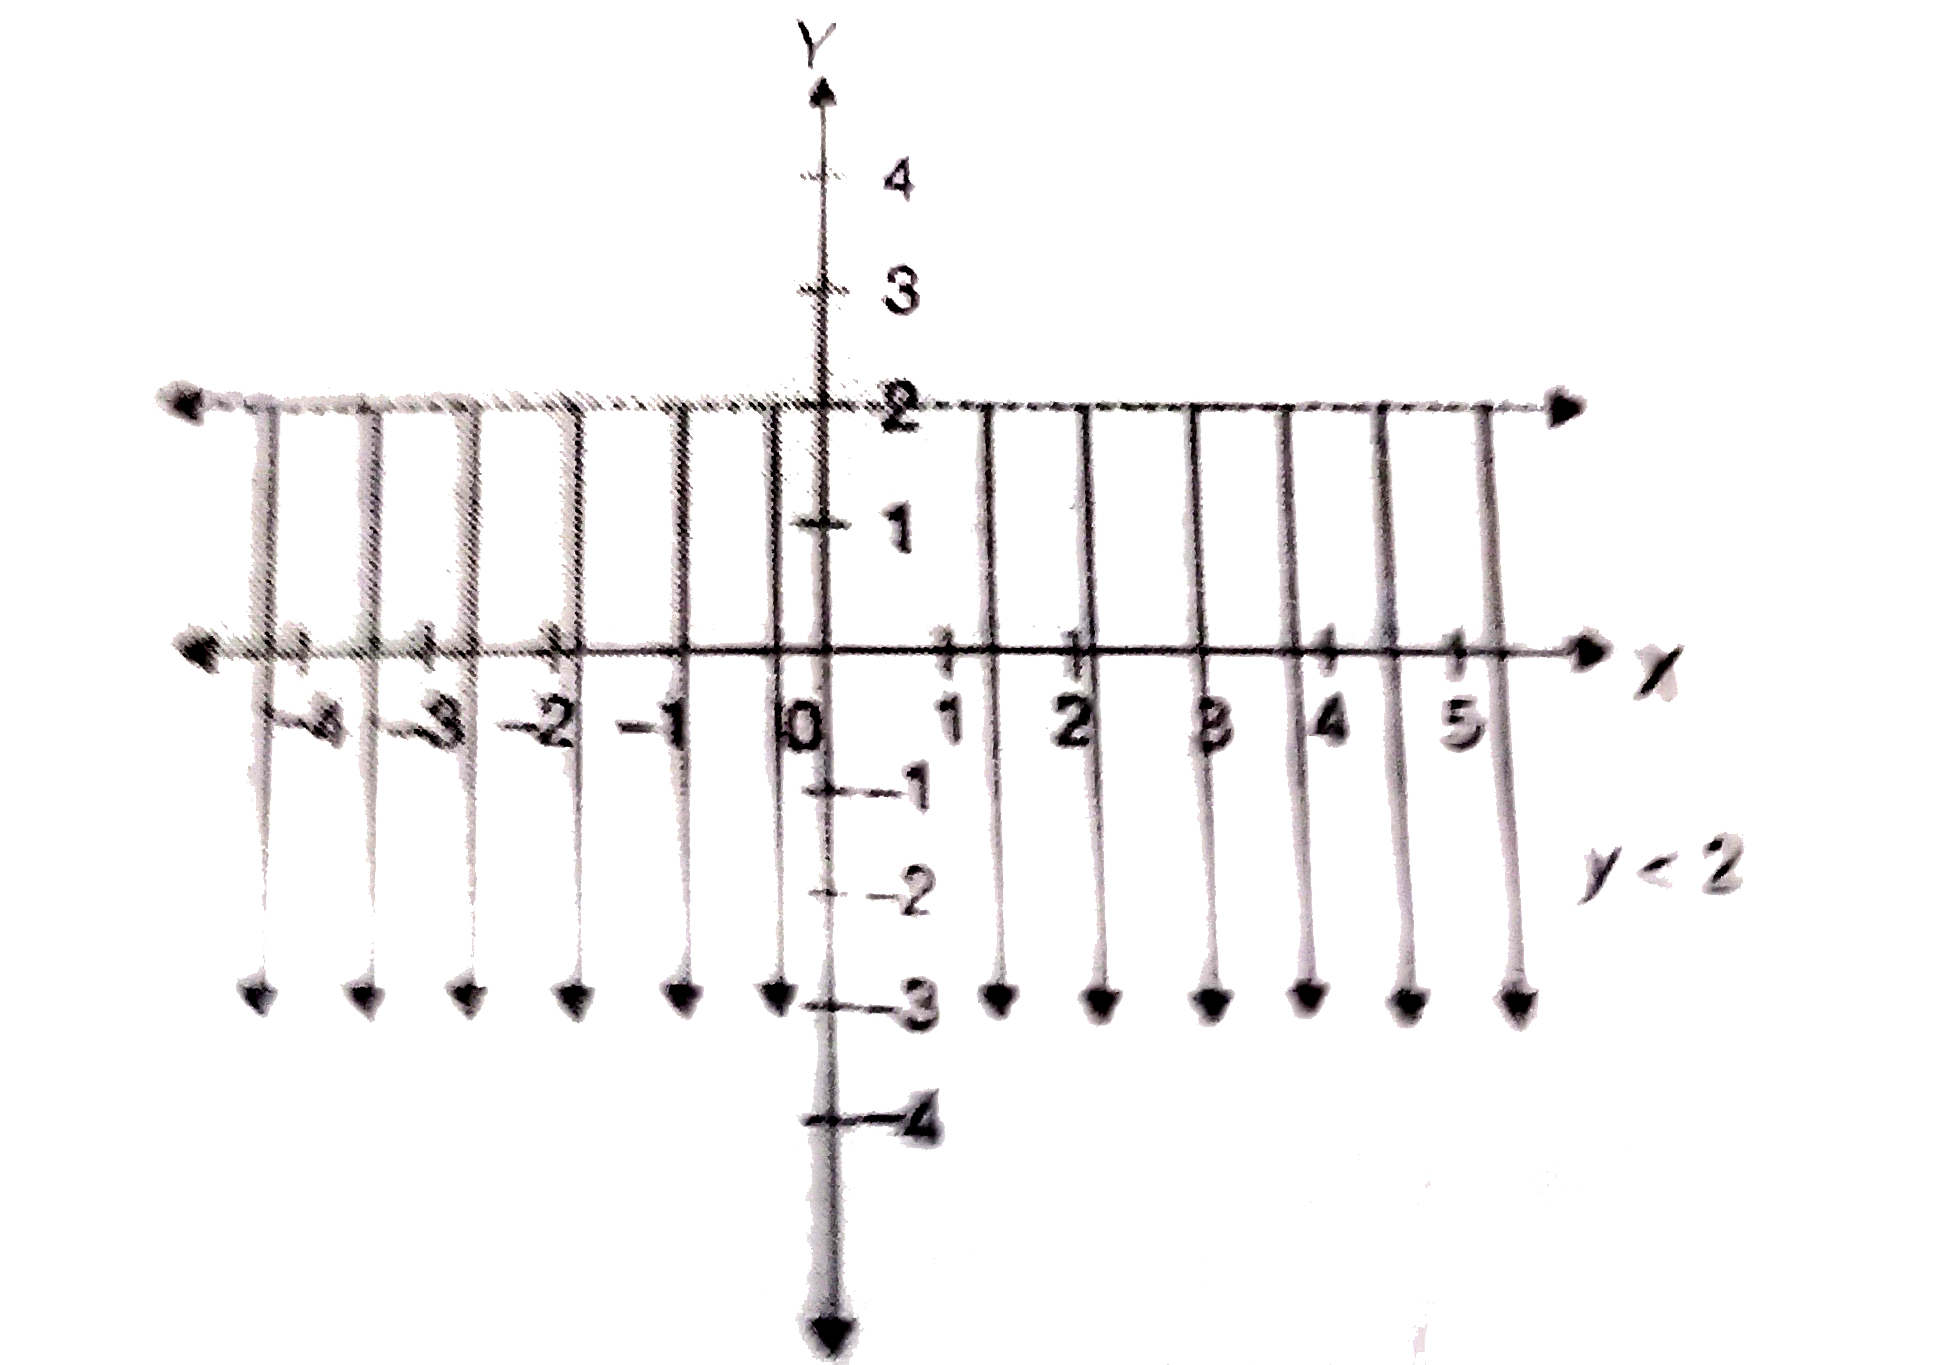
Draw the graph of y<2 in the Cartesian plane
Video Solution
Text Solution
Draw the line y=2 with dots since the boundary line does not belong to the graph and then shade the region y<2
|
Topper's Solved these Questions
- LINEAR EQUATIONS AND INEQUATIONSBOOK - PEARSON IIT JEE FOUNDATIONCHAPTER - LINEAR EQUATIONS AND INEQUATIONSEXERCISE - Very short Answer Type Questions
30 Videos
- LINEAR EQUATIONS AND INEQUATIONSBOOK - PEARSON IIT JEE FOUNDATIONCHAPTER - LINEAR EQUATIONS AND INEQUATIONSEXERCISE - Short Answer Type Questions
14 Videos
- GEOMETRYBOOK - PEARSON IIT JEE FOUNDATIONCHAPTER - GEOMETRYEXERCISE - CONCEPT APPLICATION
61 Videos
- LOCUSBOOK - PEARSON IIT JEE FOUNDATIONCHAPTER - LOCUSEXERCISE - Level 3
15 Videos
Similar Questions
Knowledge Check
The graph of y<3 is
A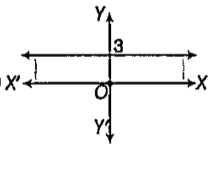 B
B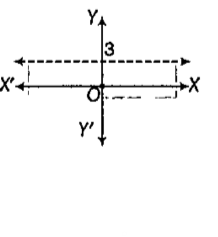 C
C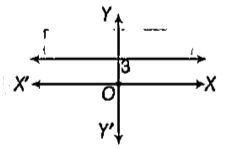 D
D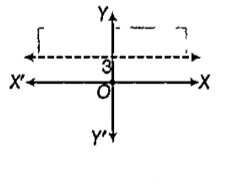
Draw the graph x−y≤1 in the cartesian plane
View SolutionDraw the graph x−y≥0 in the Cartesian plane.
View SolutionDraw the graph of y=2x.
View SolutionDraw the graph of y≤x+2.
View SolutionDraw the graph of y=|x|
View SolutionDraw the graph of y=|x|+2
View SolutionDraw the graph of y≤x+2.
View Solution