
In x denotes the percentage increase in the number of first generation innigrants from 1990 -2000 and y denotes the percantege increase in the total population of US from 1990-2000 which of the following is equal to (x-y) ?
0.125
0.122
0.096
0.075
The correct Answer is:D
(i) Find X and Y using th given information.
(ii) First find population of the first generation immigrants in 1990 and 2000 , i.e., 3% of 8k and 3.2% of 9k.
(iii) When find percentage increase (x)
(iv) y=1k8k(100) and then find (x-y)
Topper's Solved these Questions
- PERCENTAGES, PROFIT AND LOSS, DISCOUNT AND PARTERSHIPBOOK - PEARSON IIT JEE FOUNDATIONCHAPTER - PERCENTAGES, PROFIT AND LOSS, DISCOUNT AND PARTERSHIPEXERCISE - Level 2
20 Videos
- PERCENTAGES, PROFIT AND LOSS, DISCOUNT AND PARTERSHIPBOOK - PEARSON IIT JEE FOUNDATIONCHAPTER - PERCENTAGES, PROFIT AND LOSS, DISCOUNT AND PARTERSHIPEXERCISE - Level 3
13 Videos
- PERCENTAGES, PROFIT AND LOSS, DISCOUNT AND PARTERSHIPBOOK - PEARSON IIT JEE FOUNDATIONCHAPTER - PERCENTAGES, PROFIT AND LOSS, DISCOUNT AND PARTERSHIPEXERCISE - Essay Type question
5 Videos
- NUMBER SYSTEMSBOOK - PEARSON IIT JEE FOUNDATIONCHAPTER - NUMBER SYSTEMSEXERCISE - Level 3
15 Videos
- POLYNOMIALS AND SQUARE ROOTS OF ALGEBRAIC EXPRESSIONSBOOK - PEARSON IIT JEE FOUNDATIONCHAPTER - POLYNOMIALS AND SQUARE ROOTS OF ALGEBRAIC EXPRESSIONSEXERCISE - Level 3
10 Videos
Similar Questions
From 1980 to 1990, the population of Mitannia increased by 6%. From 1990 to 2000, it decreased by 3%. What was the overall percentage change in the population of Mitannia from 1980 to 2000?
View SolutionGiven below is a bar diagram showing the percentage of Hindus, Sikhs and muslims in a state during the years 1989 to 1992.
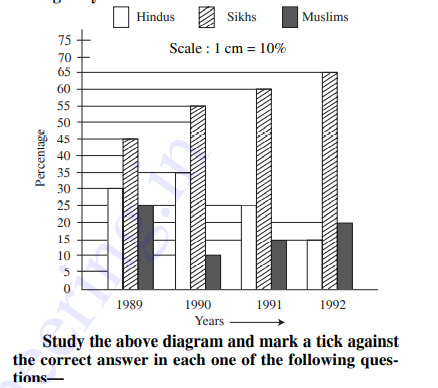
What percentage was the increase in Muslim populations from 1990 to 1992 ?
View Solution
Knowledge Check
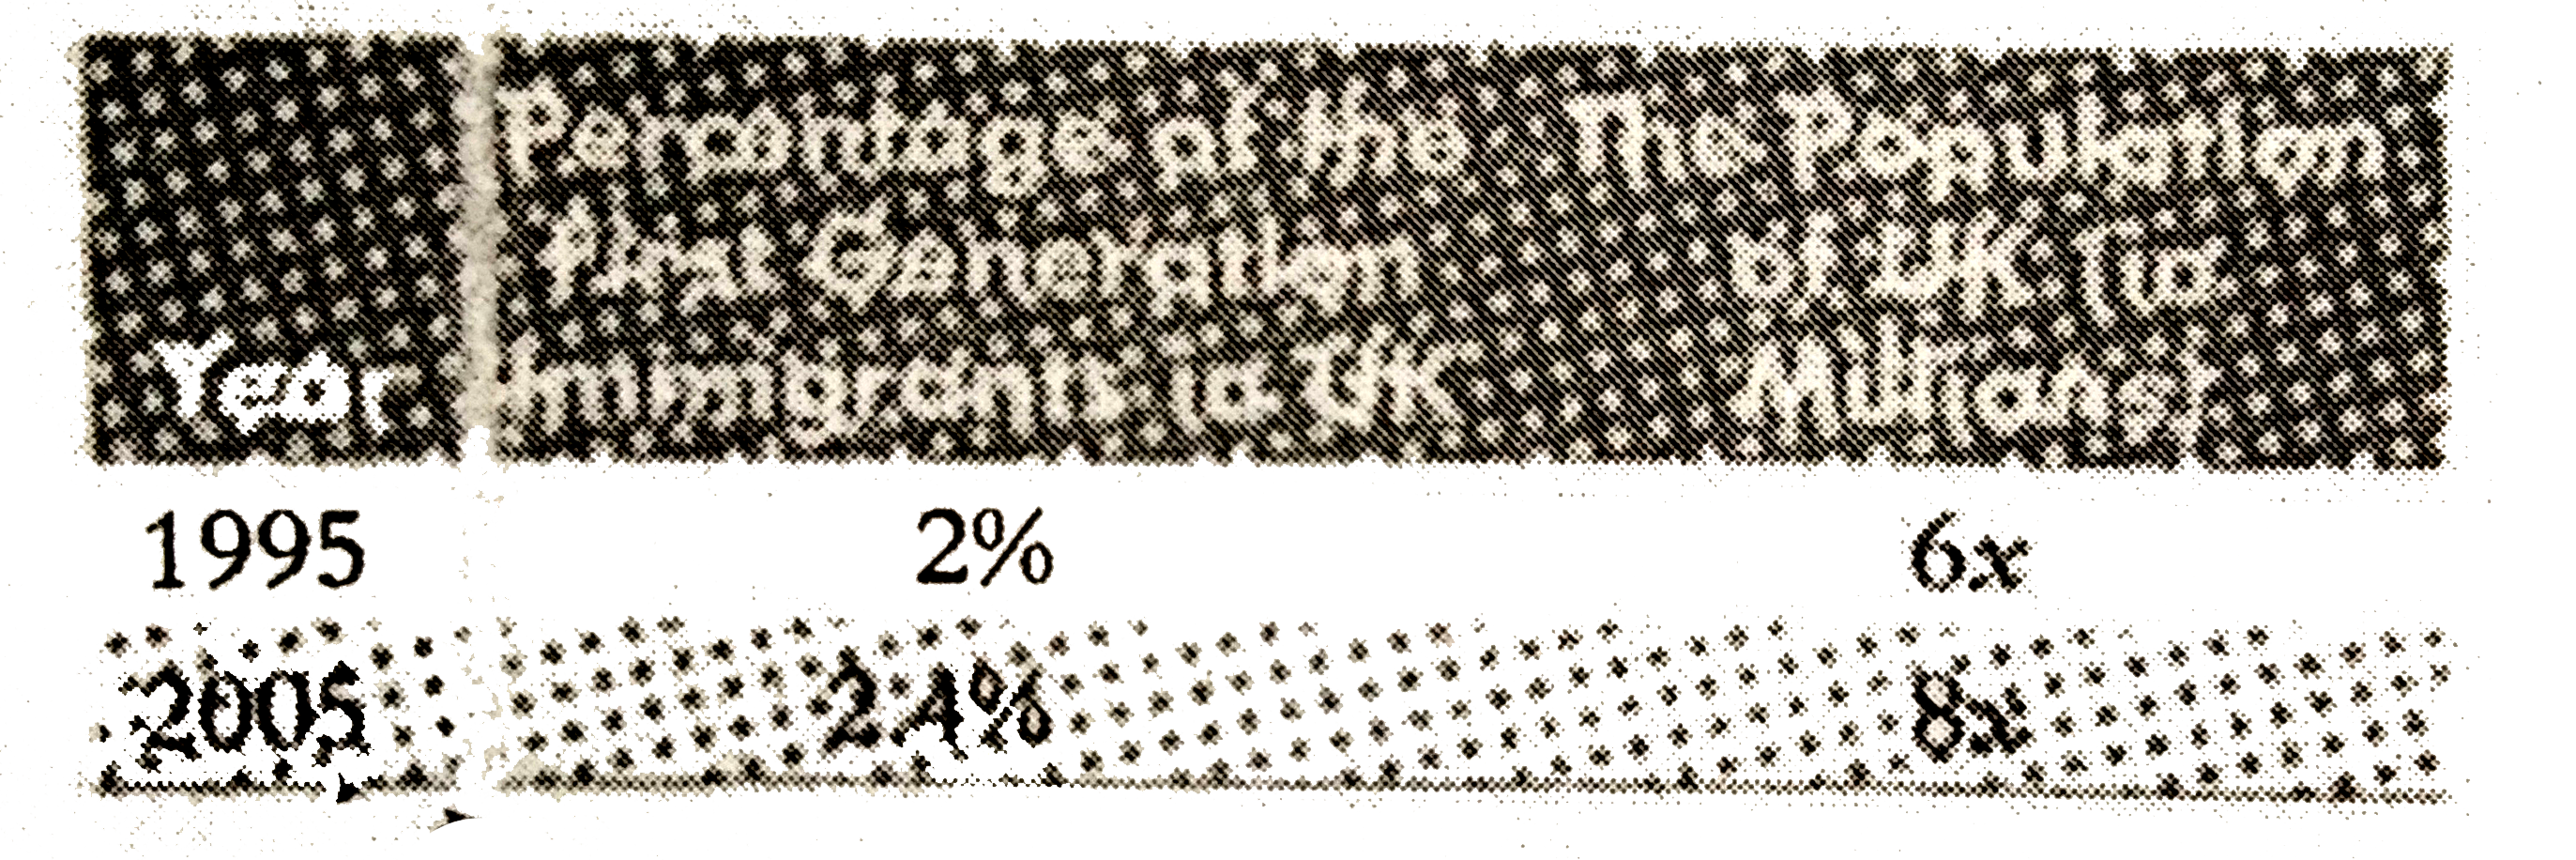
If p denotes the percentage increase in the number of the first generation immigrants from 1995-2005 and q denotes the percentage increase in the total UK population from 1995-2005 find p-qA13.13%B26.23%C33.13%D46.23%Number of different colleges in India in different years is given in the graph below. Distribution of different colleges in the years 1980 and 1990 shown in the pie charts below :
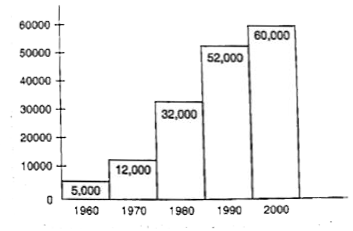
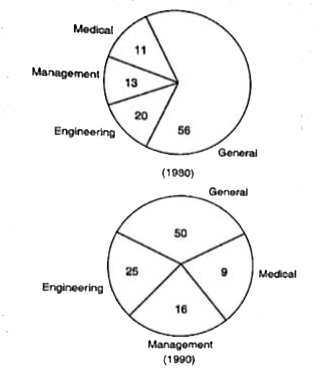
What is percentage increase in the number of colleges from 1960 to 1990 ?A1000%B940%C1040%D470%The percentag increases in the total number of students of a school over that in the previous year.
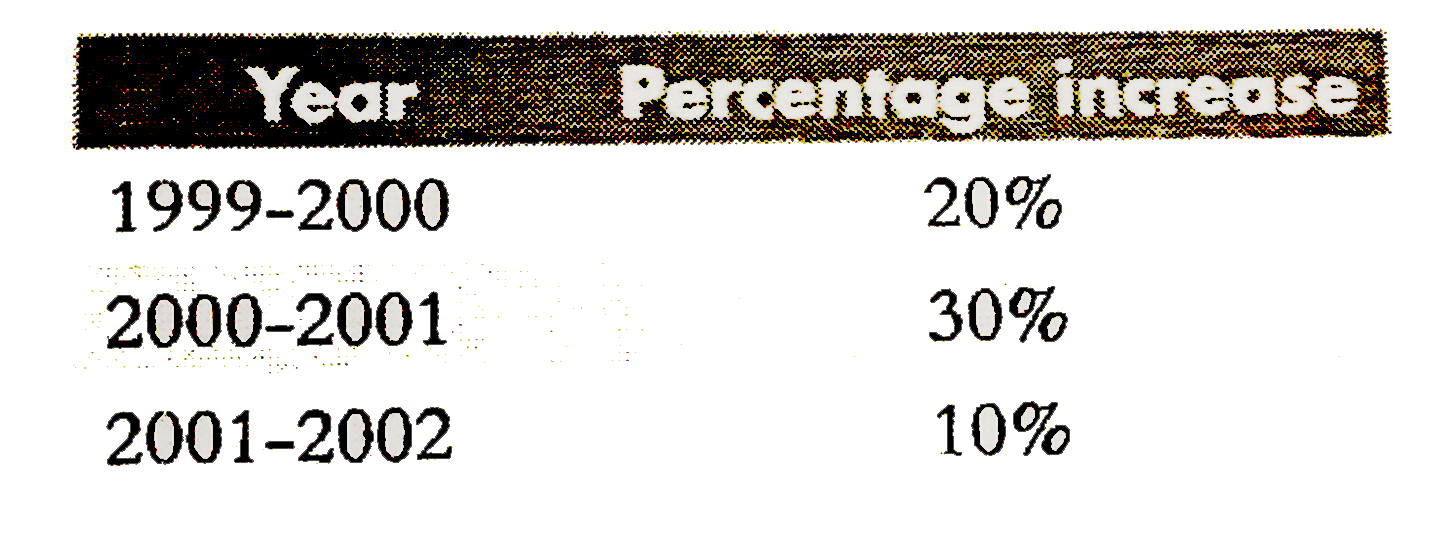
Find the effective percentage increase in the number of students from 1998-1999 to 2000-2001.A0.316B0.72C0.62D0.82
If A denotes the area enclosed by 3|x|+4|y|≤12 then A is equal to
View SolutionThe percentag increases in the total number of students of a school over that in the previous year.

Find the effective percentage increase in the number of students from 1998-1999 to 2000-2001.
View SolutionFollowing table gives the population of a from 1998 to 1992
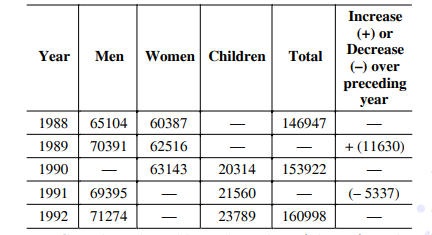
complete the table and mark a tick against the correct answer in each question
Number of men in 1990 is -----
View SolutionThe table given below show number of literate people and population in a village from the year 2011 to 2016.
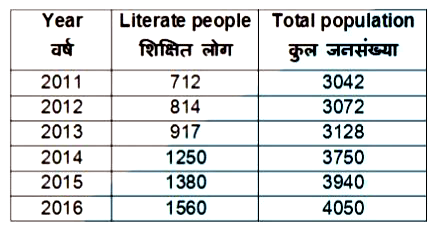
What is the percentage increase (approximately) in the total population in the year 2012 in comparison to year 2011?
View SolutionThe table given below shows number of literate people and total population in a village from the year 2011 to 2016.

What is the percentage increase (approximately) in the total population in the year 2012 in comparison to year 2011?
View Solution
