Following table gives the population of a from 1998 to 1992
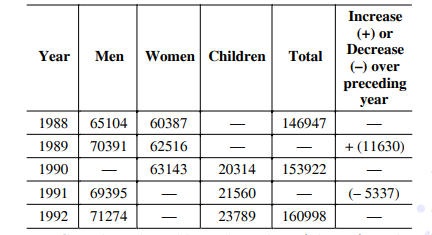
complete the table and mark a tick against the correct answer in each question
Number of men in 1990 is -----
40645
60454
70465
58835
The correct Answer is:C
Step by step video, text & image solution for Following table gives the population of a from 1998 to 1992 complete the table and mark a tick against the correct answer in each question Number of men in 1990 is ----- by Maths experts to help you in doubts & scoring excellent marks in Class 14 exams.
Topper's Solved these Questions
Similar Questions
Directions : Following table gives then population of locallity from 1988 to 1992 . Read the table and answer the questions.
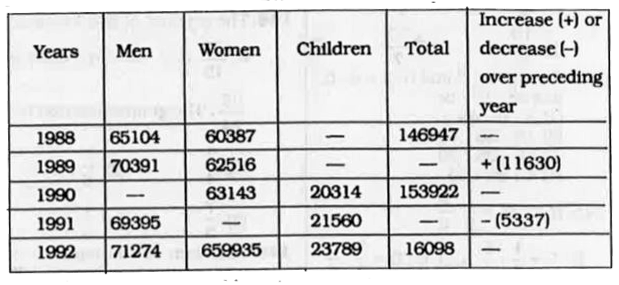
Number of children in 1989 isView SolutionDirections : Following table gives then population of locallity from 1988 to 1992 . Read the table and answer the questions.

Number of children in 1989 isView Solution
Knowledge Check
- Question 1 - Select One
Following table gives the population of a from 1998 to 1992
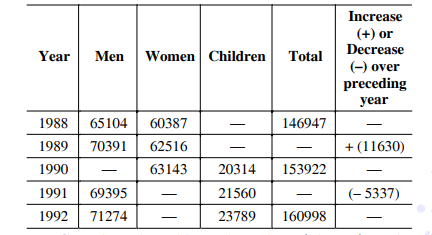
Complete the table and mark a tick against the correct answer in the question ------A31236B125491C14546D21456 - Question 2 - Select One
Following table gives the population of a from 1998 to 1992

complete the table and mark a tick against the correct answer in each question
Number of men in 1990 is -----A40645B60454C70465D58835 - Question 3 - Select One
Following table gives the population of a from 1998 to 1992
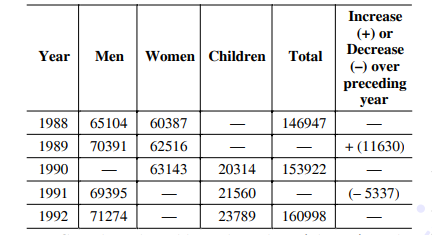
Number of children in 1989 is -----A25670B14040C13970D15702
Following table gives the population of a from 1998 to 1992
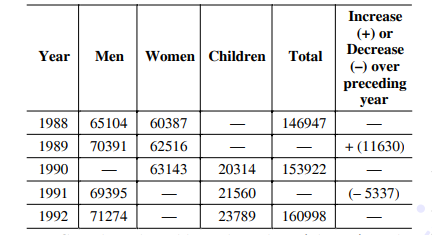
Number of women in 1991 is -----View SolutionFollowing table gives the population of a from 1998 to 1992
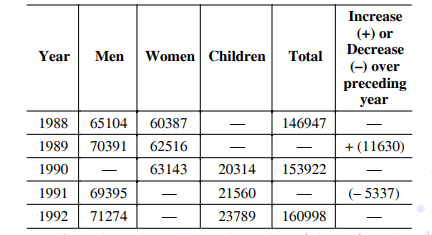
The total population in 1989 is -----View SolutionThe following table gives the plan outlay for 1987-88 for
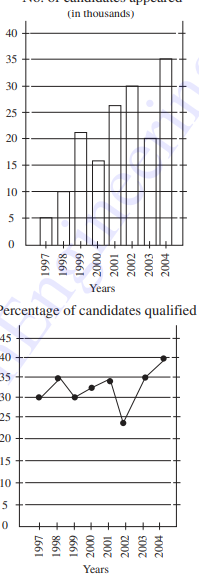
Study the table and mark a tick (sqrt) against the correct answer in each questions given below-
Which area received minimum consideration in State A?View SolutionThe following table gives the plan outlay for 1987-88 for
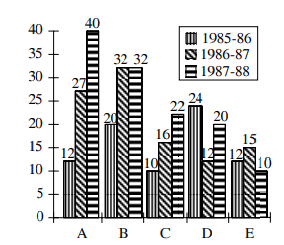
Study the table and mark a tick (sqrt) against the correct answer in each questions given below-
The total plan outlay for A and C is in the ratio-View SolutionFollowing table gives the populations of a locality from 1988 to 1992. Read the table and answer the questions.

Number of women in 1991 is :View Solution

