The given bar diagram shows the population size of Rana hexadactyla in the rice fields of Malabar. Observe and analyse the graph.

a. Write your findings from the graph
b. Predict the population of frogs in the near future
c. Enlist the reasons for this effect
a. The number of frogs decreases
b. Extinction
c. • Habitat destruction
• Excess use of pesticides
• Change in climate
• Use of agricultural machines
• Excessive killing
• Export
Topper's Solved these Questions
- BIODIVERSITY AND CONSERVATION BOOK - NEW JOYTHI PUBLICATIONCHAPTER - BIODIVERSITY AND CONSERVATION EXERCISE - QUESTIONS FROM EDUMATE
4 Videos
- BIODIVERSITY AND CONSERVATION BOOK - NEW JOYTHI PUBLICATIONCHAPTER - BIODIVERSITY AND CONSERVATION EXERCISE - PREVIOUS YEAR HSE QUESTIONS
9 Videos
- BIODIVERSITY AND CONSERVATION BOOK - NEW JOYTHI PUBLICATIONCHAPTER - BIODIVERSITY AND CONSERVATION EXERCISE - PREVIOUS YEAR COMPETITIVE EXAM QUESTIONS
17 Videos
- BIOTECHNOLOGY : PRINCIPLES AND PROCESSES BOOK - NEW JOYTHI PUBLICATIONCHAPTER - BIOTECHNOLOGY : PRINCIPLES AND PROCESSES EXERCISE - CBSE Corner
12 Videos
Similar Questions
The Bar Graph given here shows the population (in crores) of India in various census years. Observe the graph and answer the question based on it.
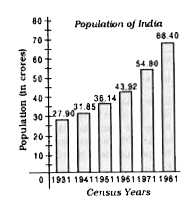
The per cent increase in population from 1971 to 1982 is
View SolutionThe Bar Graph given here shows the population (in crores) of India in various census years. Observe the graph and answer the question based on it.
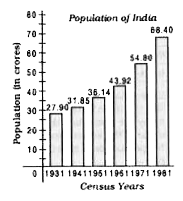
Inh which census year, the per cent increase in population is highest as compared to that in the previous census year ?
View Solution
Knowledge Check
Read the following text and answer the following question on the basis of the same :
Growth of population with time shows specific and predictable patters. Two types of growth patter of populaiton are exponetial and logistic growth . When resource in the habitat are unlimited each species has the ability to relize fully its innate potential to grow in number . Then the population gorws in exponential fashion . When the resource are limited growth curve shows an inital slow rate and then it accelerates and finally slows giving the gorwth curve which is sigmoid .
Study the population growth curves (A and B) in the given graph and select the incorrect statement :
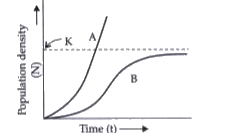 ACurve 'A' shows exponential growth represented by equation dN/dt=rNBCurve 'B' shows logistic growth , represented by equation dN/dt=r(K−N)/KCExponential growth curved is considered as more realistic than the logistic growth curveDCurve 'A' can also be represented by equation Nt=N0en
An atom is assumed to tbe spherical in shape and thus, the size of atom is generally given in terms of radius of the sphere and is called atomic radius. It is usually defined as the distance between the centre of the nucleus and outermost shell where electron are present. The exact measure of atomic radius is not easy due to following reasons:
(i) The atom does not have well defined boundary. the probability of finding the electron is never zero even at large distance from the nucleus.
(ii) It is not possible to get an isolated atom. the electron density around an atom is affected by the presence of neighbouring atoms, i.e., the size of the atom changes in going from one set of environement to another.
(iii) the size of an atom is very small, of the order of about 1.2 Å,i.e., 1.2×10⁻¹⁰m.
An estimate of the size of the atom can, however, be made by knowing the distance betweent he atoms in the combined state. the distance between the atoms, i.e., bond length are generally measured by the application of techniques such as X-ray differaction, electron diffraction, infrared spectroscopy, nuclear magnetic resonance spectroscopy, etc. However, bond lengths change with different type of bonding. Three types of radius are commonly used, i.e.,
(a) Covalent radius (b) crystals radius (c) Vander waal's radius
The correct order of effective nuclear charge Zeff isAB<C<N<O<FBB=C=N=O=FCB>C>N>O>FDnone of these
The given bar graph shows the amount of wheat purchased by government during the year 1998-2002.
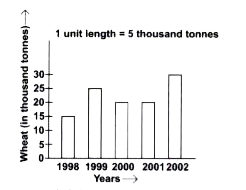
Read the bar graph and write down your observations. In which year was
the wheat production maximum ?
View SolutionThe given bar graph shows the amount of wheat purchased by government during the year 1998-2002.
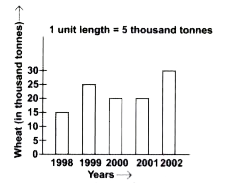
Read the bar graph and write down your observations. In which year was
the wheat production minimum ?
View SolutionThe Bar Graph given here shows the population (in crores) of India in various census years. Observe the graph and answer the question based on it.

Inh which census year, the per cent increase in population is least as compared to that in the previous census year ?
View SolutionThe given bar graph shows the number of identical articles sold by 5 different stores A, B, C, D and E during a particular month.
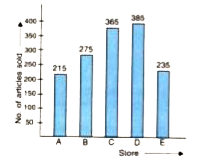
Study the bar graph and answer the following questions :
(i) Which store sold the largest number of articles ?
(ii) By what per cent is the sale of store D more than that of store B ?
(iii) Find the ratio of the total sale of the two highest selling stores to the total sale of the two least selling stores.
(iv) By how much must store E increase its sale to catch up with its nearest rival store ?
View SolutionThe bar graph given below represents the circulation of newspapers (dailies) in a town in six languages (the figures are approximated to hundreds).
f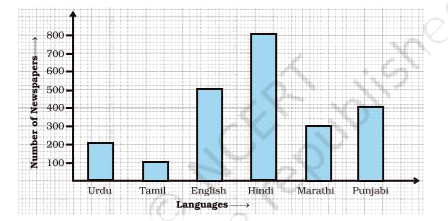
Study the bar graph and answer the following questions:
(a) Find the total number of newspapers read in Hindi, Punjabi, Urdu, Marathi and Tamil.
(b) Find the excess number of newspapers read in Hindi than those in English.
(c) Name the language in which the least number of newspapers are read.
(d) Write the total circulation of newspapers in the town.
View SolutionIn a given question below is a statement followed by two conclusions numbered I and II. You have to assume everything in the statement to be true, then consider the two conclusions together and decide which of them logically follows beyond a reasonable doubt from the information given in the statement.
Give answer
(a) if only conclusion I follows, (b) if only conclusion II follows,
(c) if either I or II follows,
(d) if neither I nor II follows: and
(e) if both I and II follow
Statement: Population increase coupled with depleting resources is going to be the scenario of many developing countries in days to come.
conclusion:
I. The population of developing countries will not continue to increase in future.
II. It will be very difficult for the governments of developing countries to provide its people decent quality of life.
View Solution
