The Bar Graph given here shows the population (in crores) of India in various census years. Observe the graph and answer the question based on it.
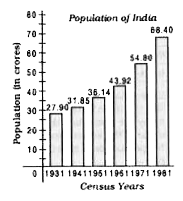
Inh which census year, the per cent increase in population is least as compared to that in the previous census year ?
1961
1951
1971
1941
The correct Answer is:B
Step by step video & image solution for The Bar Graph given here shows the population (in crores) of India in various census years. Observe the graph and answer the question based on it. Inh which census year, the per cent increase in population is least as compared to that in the previous census year ? by Maths experts to help you in doubts & scoring excellent marks in Class 14 exams.
Updated on:21/07/2023Topper's Solved these Questions
- STATISTICS AND DATA INTERPRETATIONBOOK - KIRAN PUBLICATIONCHAPTER - STATISTICS AND DATA INTERPRETATIONEXERCISE - TYPE-III
39 Videos
- STATISTICS AND DATA INTERPRETATIONBOOK - KIRAN PUBLICATIONCHAPTER - STATISTICS AND DATA INTERPRETATIONEXERCISE - TYPE-IV
182 Videos
- STATISTICS AND DATA INTERPRETATIONBOOK - KIRAN PUBLICATIONCHAPTER - STATISTICS AND DATA INTERPRETATIONEXERCISE - TYPE-VIII
8 Videos
- SIMPLIFICATIONBOOK - KIRAN PUBLICATIONCHAPTER - SIMPLIFICATIONEXERCISE - TEST YOURSELF
25 Videos
- TIME AND DISTANCEBOOK - KIRAN PUBLICATIONCHAPTER - TIME AND DISTANCEEXERCISE - Type -XI
74 Videos
Similar Questions
The Bar Graph given here shows the population (in crores) of India in various census years. Observe the graph and answer the question based on it.

Inh which census year, the per cent increase in population is highest as compared to that in the previous census year ?
View SolutionThe Bar Graph given here shows the population (in crores) of India in various census years. Observe the graph and answer the question based on it.
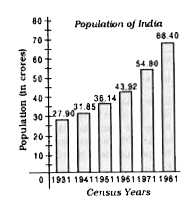
The per cent increase in population from 1971 to 1982 is
View Solution
Knowledge Check
Study the following bar graph and answer the question that follows.
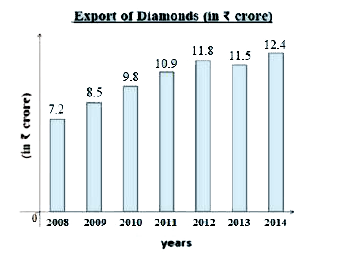
In which year was the maximum percentage increase in diamond exports compared to the previous year?A2014B2009C2010D2012The given bar graph shows the biscuit exports of India over a period of five years. Study the graph and answer the questions that follows
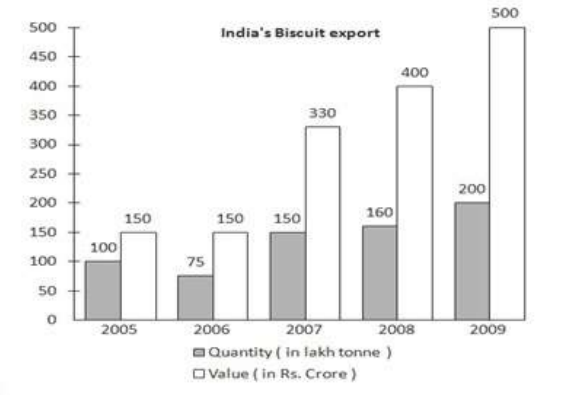
In which two year was the value per tonne equal?A2006 and 2007B2008 and 2009C2007 and 2008D2005 and 2006Study the following graph carefully and answer the questions given below it -----
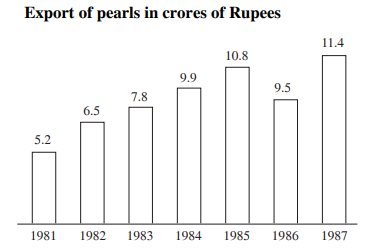
In which year there was maximum percentage increase in export of pearls to that in the previous year ?A1982B1987C1985D1984
Study the following graph carefully and answer the given questions.
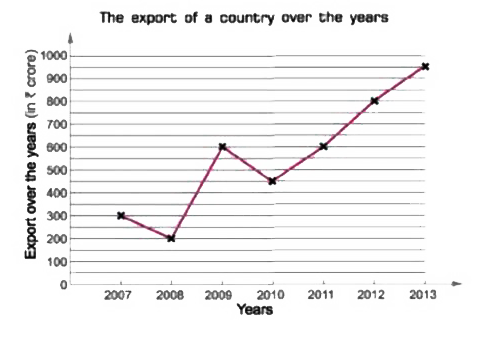
Which year has the highest per cent increase/decrease in exports as compared to the preceding year ?
View SolutionRead the bar graph given below and answer the following questions:
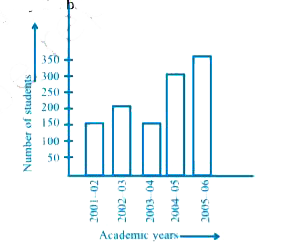
In which year is the increase in number of students maximum as compared to the previous year?
View SolutionStudy the following table and answer the questions based on it : (in lakhs of Rs.)
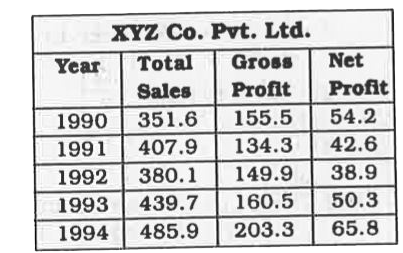
The per cent increase in the gross profit was the maximum in which year as compared to the previous one?
View SolutionStudy the following table and answer the questions based on it : (in lakhs of Rs.)

The percent increase in the gross profit was the maximum in which year as compared to the previous one?
View SolutionStudy the following graph and answer the given questions
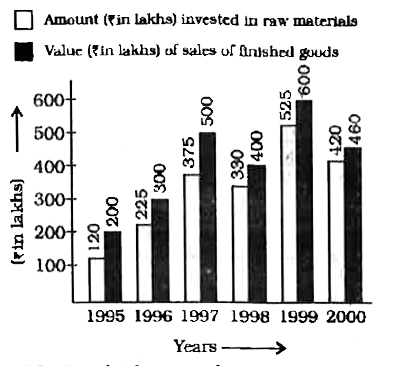
In which year, there has been a maximum percentage increase in the amount invested in raw materials as compared to the previous year ?
View Solution
