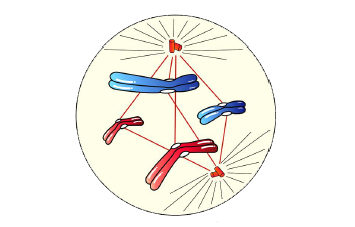
Give a common title to the following diagrams. Identify each and present the answer in the form of a list.

Text Solution
Artifical vegetative propagation
(i). Budding or bud grafting.
(ii). Approach grafting
(iii). Air layering
|
Topper's Solved these Questions
- REPRODUCTION IN ORGANISMSBOOK - NEW JOYTHI PUBLICATIONCHAPTER - REPRODUCTION IN ORGANISMSEXERCISE - Previous Entrance Exam Corner
5 Videos
- REPRODUCTION IN ORGANISMSBOOK - NEW JOYTHI PUBLICATIONCHAPTER - REPRODUCTION IN ORGANISMSEXERCISE - CBSE Corner
3 Videos
- REPRODUCTION IN ORGANISMSBOOK - NEW JOYTHI PUBLICATIONCHAPTER - REPRODUCTION IN ORGANISMSEXERCISE - New Evaluation Type Questions
10 Videos
- PRINCIPLES OF INHERITANCE AND VARIATION BOOK - NEW JOYTHI PUBLICATIONCHAPTER - PRINCIPLES OF INHERITANCE AND VARIATION EXERCISE - PREVIOUS YEAR COMPETITIVE EXAM QUESTIONS
72 Videos
- REPRODUCTIVE HEALTH BOOK - NEW JOYTHI PUBLICATIONCHAPTER - REPRODUCTIVE HEALTH EXERCISE - PREVIOUS YEAR HSE QUESTIONS
4 Videos
Similar Questions
Knowledge Check
Identify the following diagram.
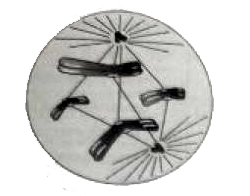 ATransition to Metaphase (Mitosis)BTransition to Anaphase-II (Meiosis)CTransition to Metaphase-I (Meiosis)DTransition to Anaphase (Mitosis)
Identify the following diagram
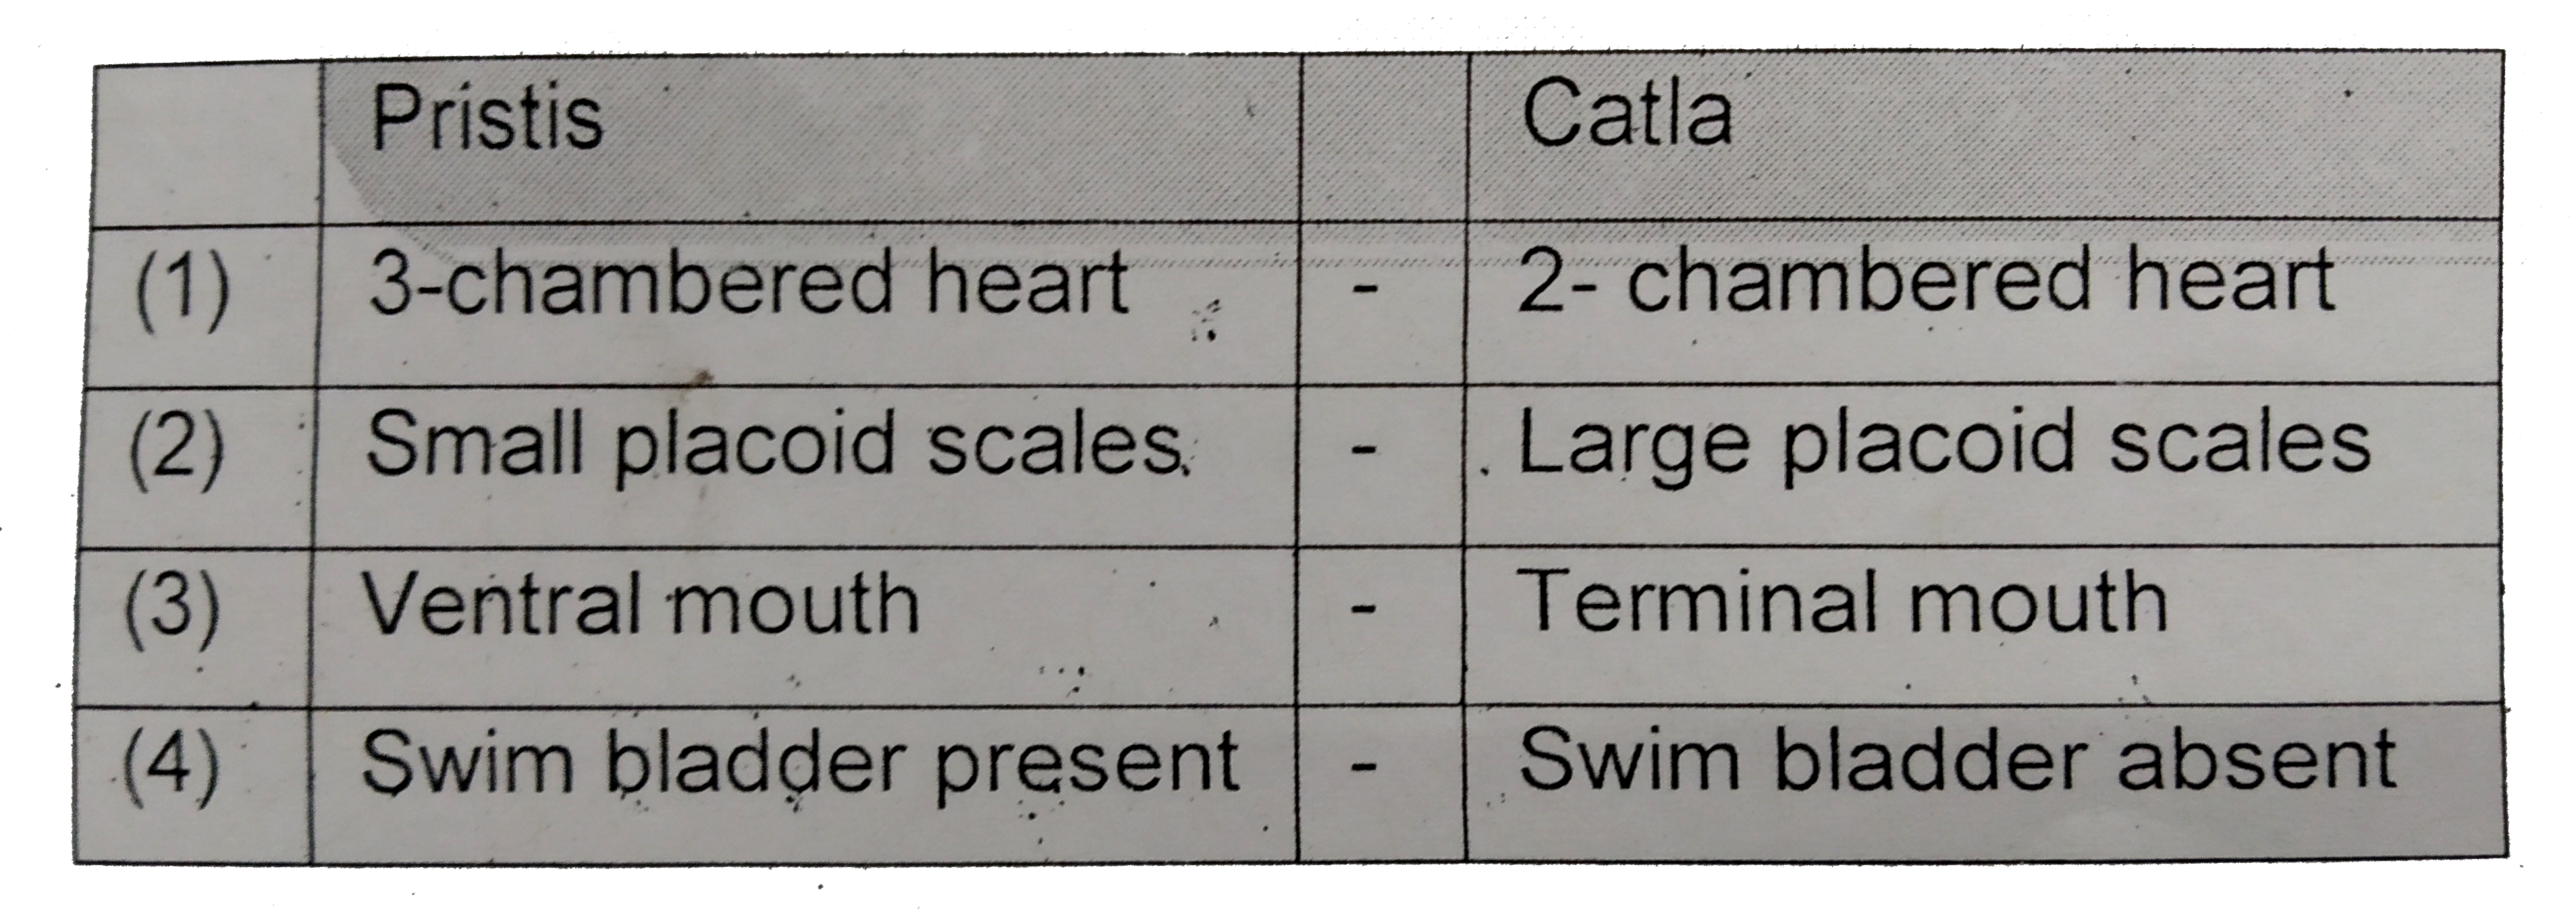 AGlandular epitheliumBCiliated epitheliumCSquamous epitheliumDAreolar connective tissue
Identify the following diagram -
 ATransition to Metaphase (mitosis)BTransition to Anaphase II (meiosis)CTransition to Metaphase-1 (meiosis).DTransition to Anaphase (mitosis)
Identify the following diagram-
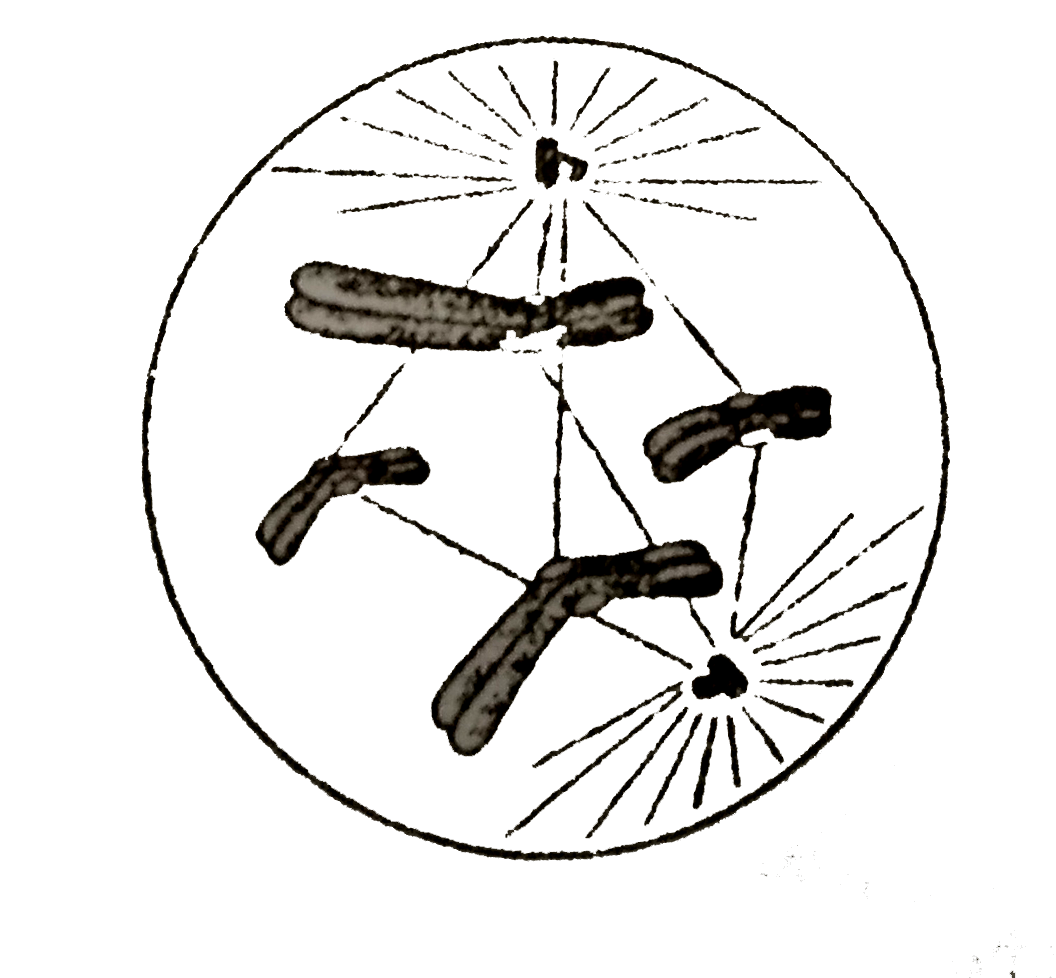
View SolutionGive a brief answer for each of the following:
View SolutionObserver the given figure and answer the following questions
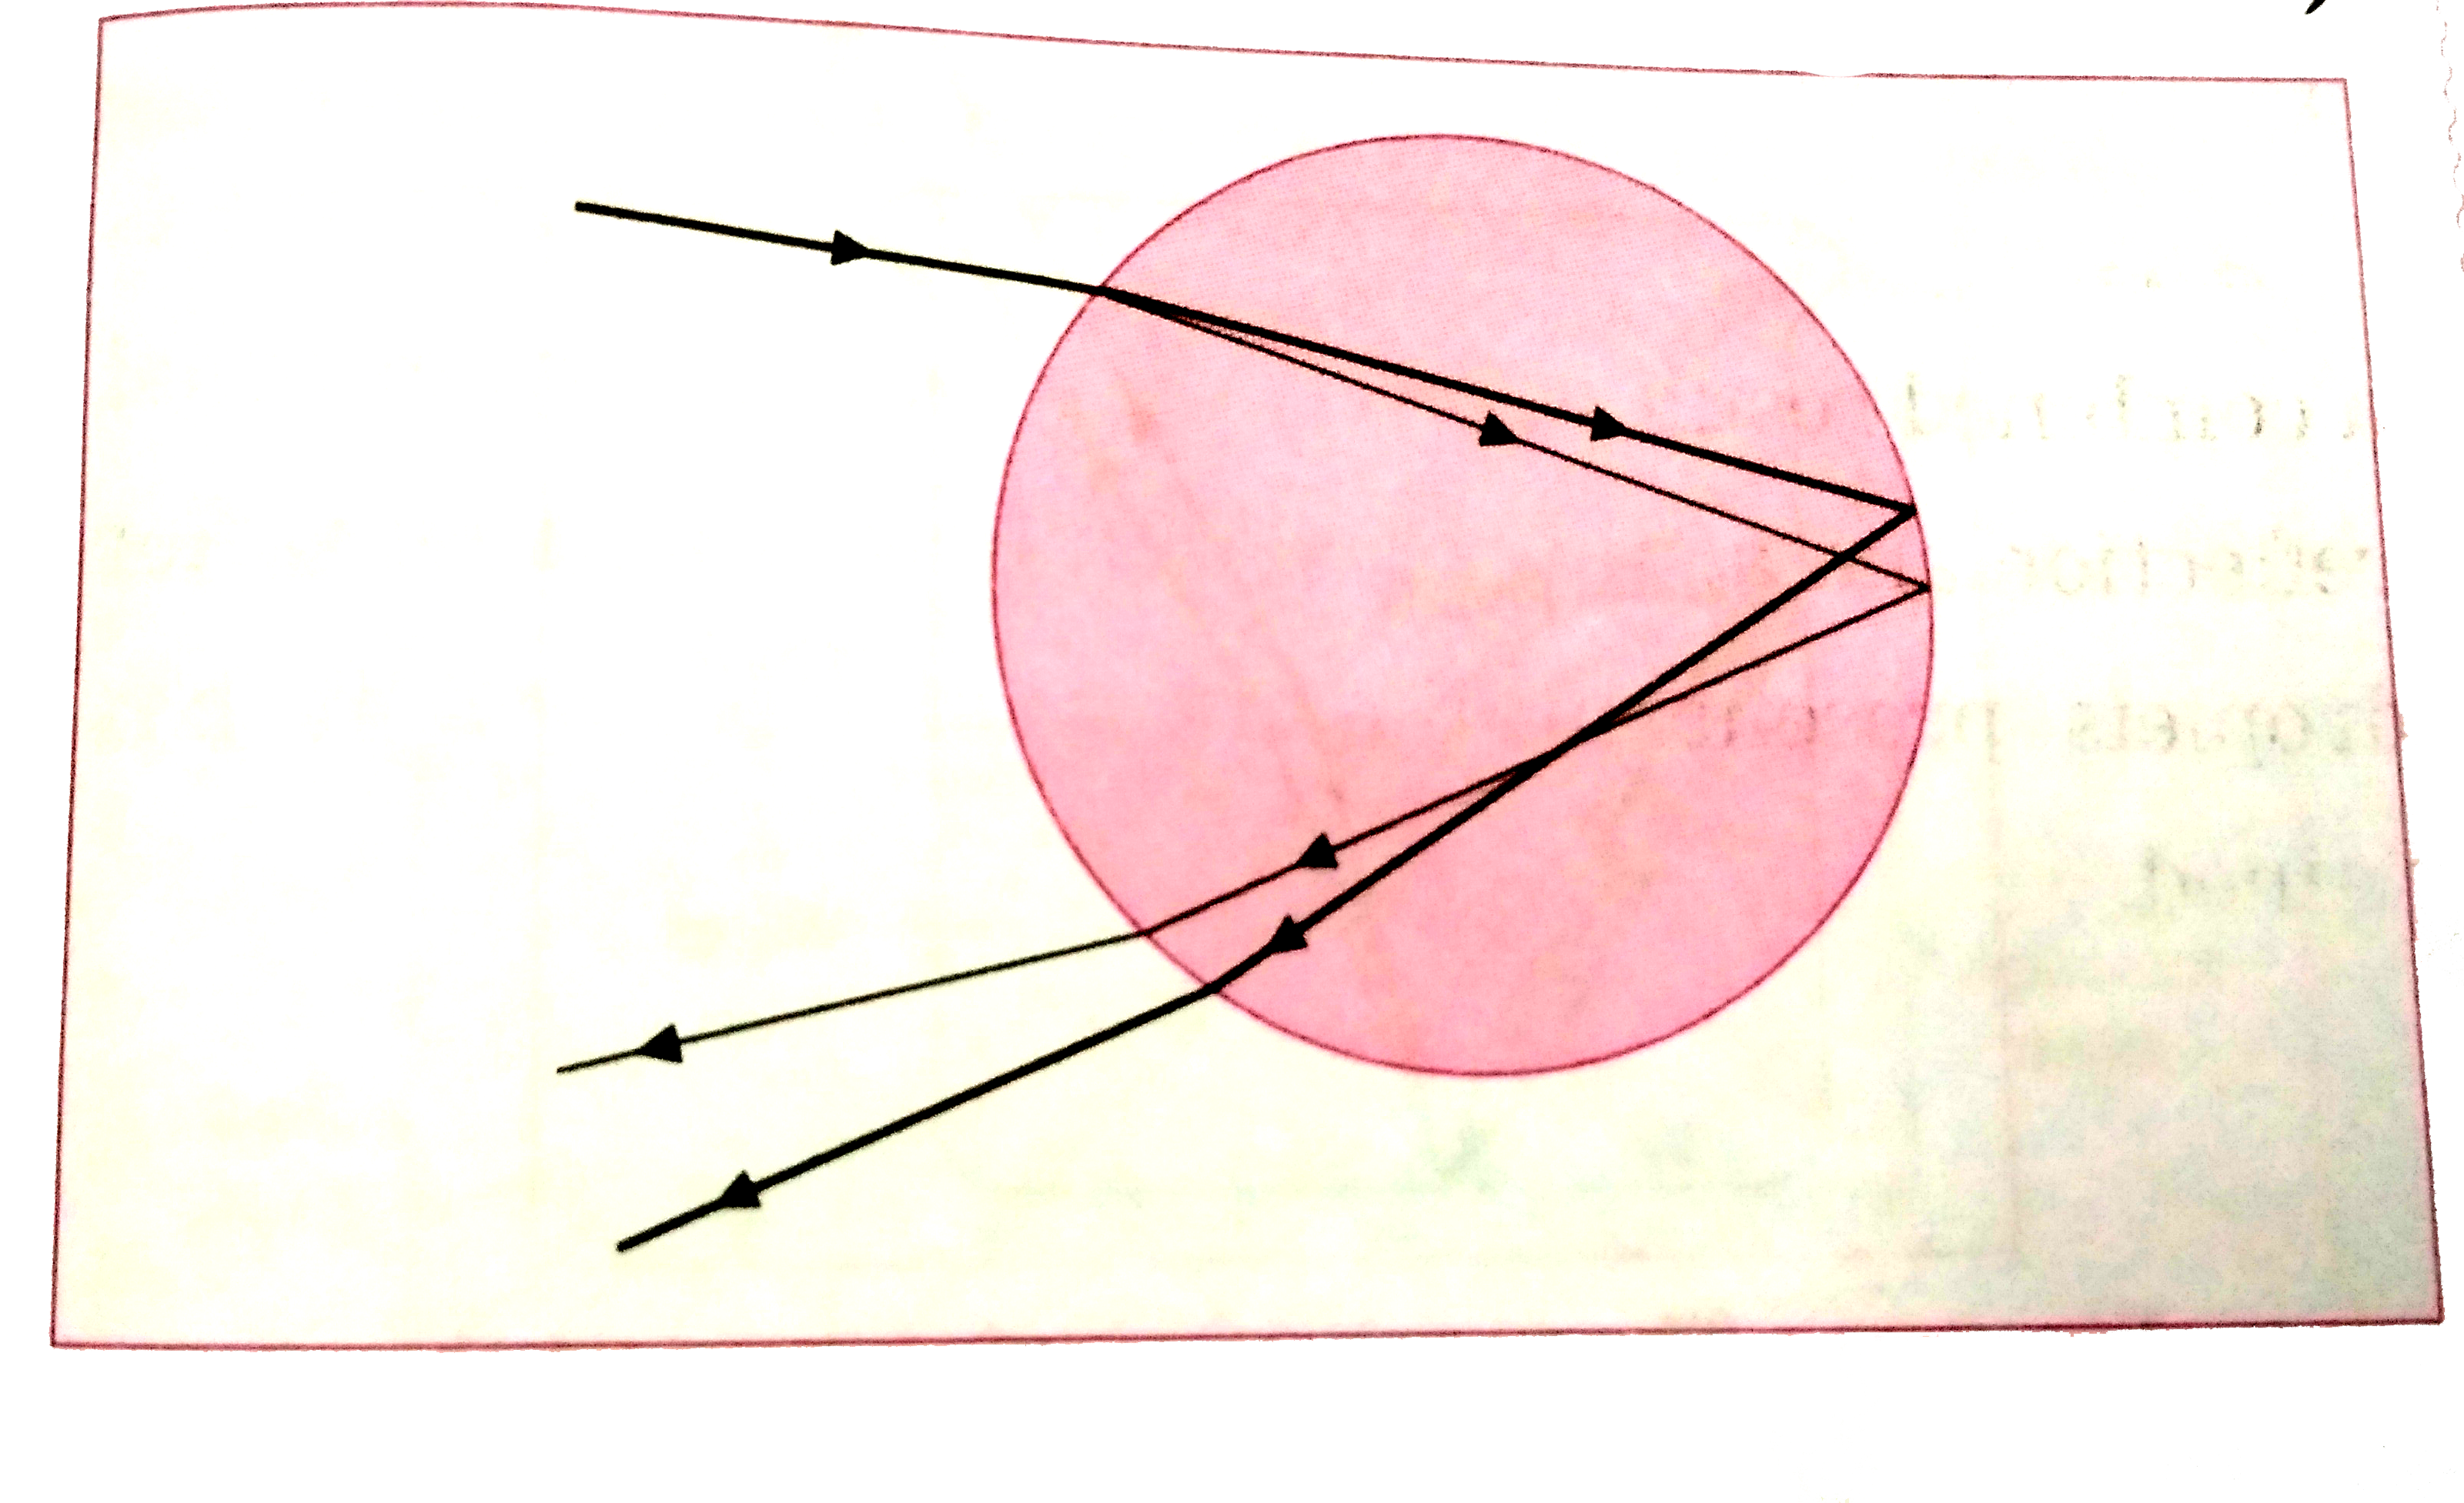
(a) Identify and write the natural process shown in the figure.
b. List the phenomena which are observed in this process.
c. Redraw the diagram and show the above phenomena in it.
View SolutionStudy the following diagram carefully and then answer the questions that follow. The diagram is depicting a defect of the human eye :
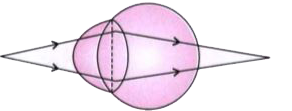
Identify the defect shown in the diagram.
View SolutionThe following table gives data on birth rate in India according to census survey of different years. Present the information the form of a vertical/simple bar diagram.

View Solution

