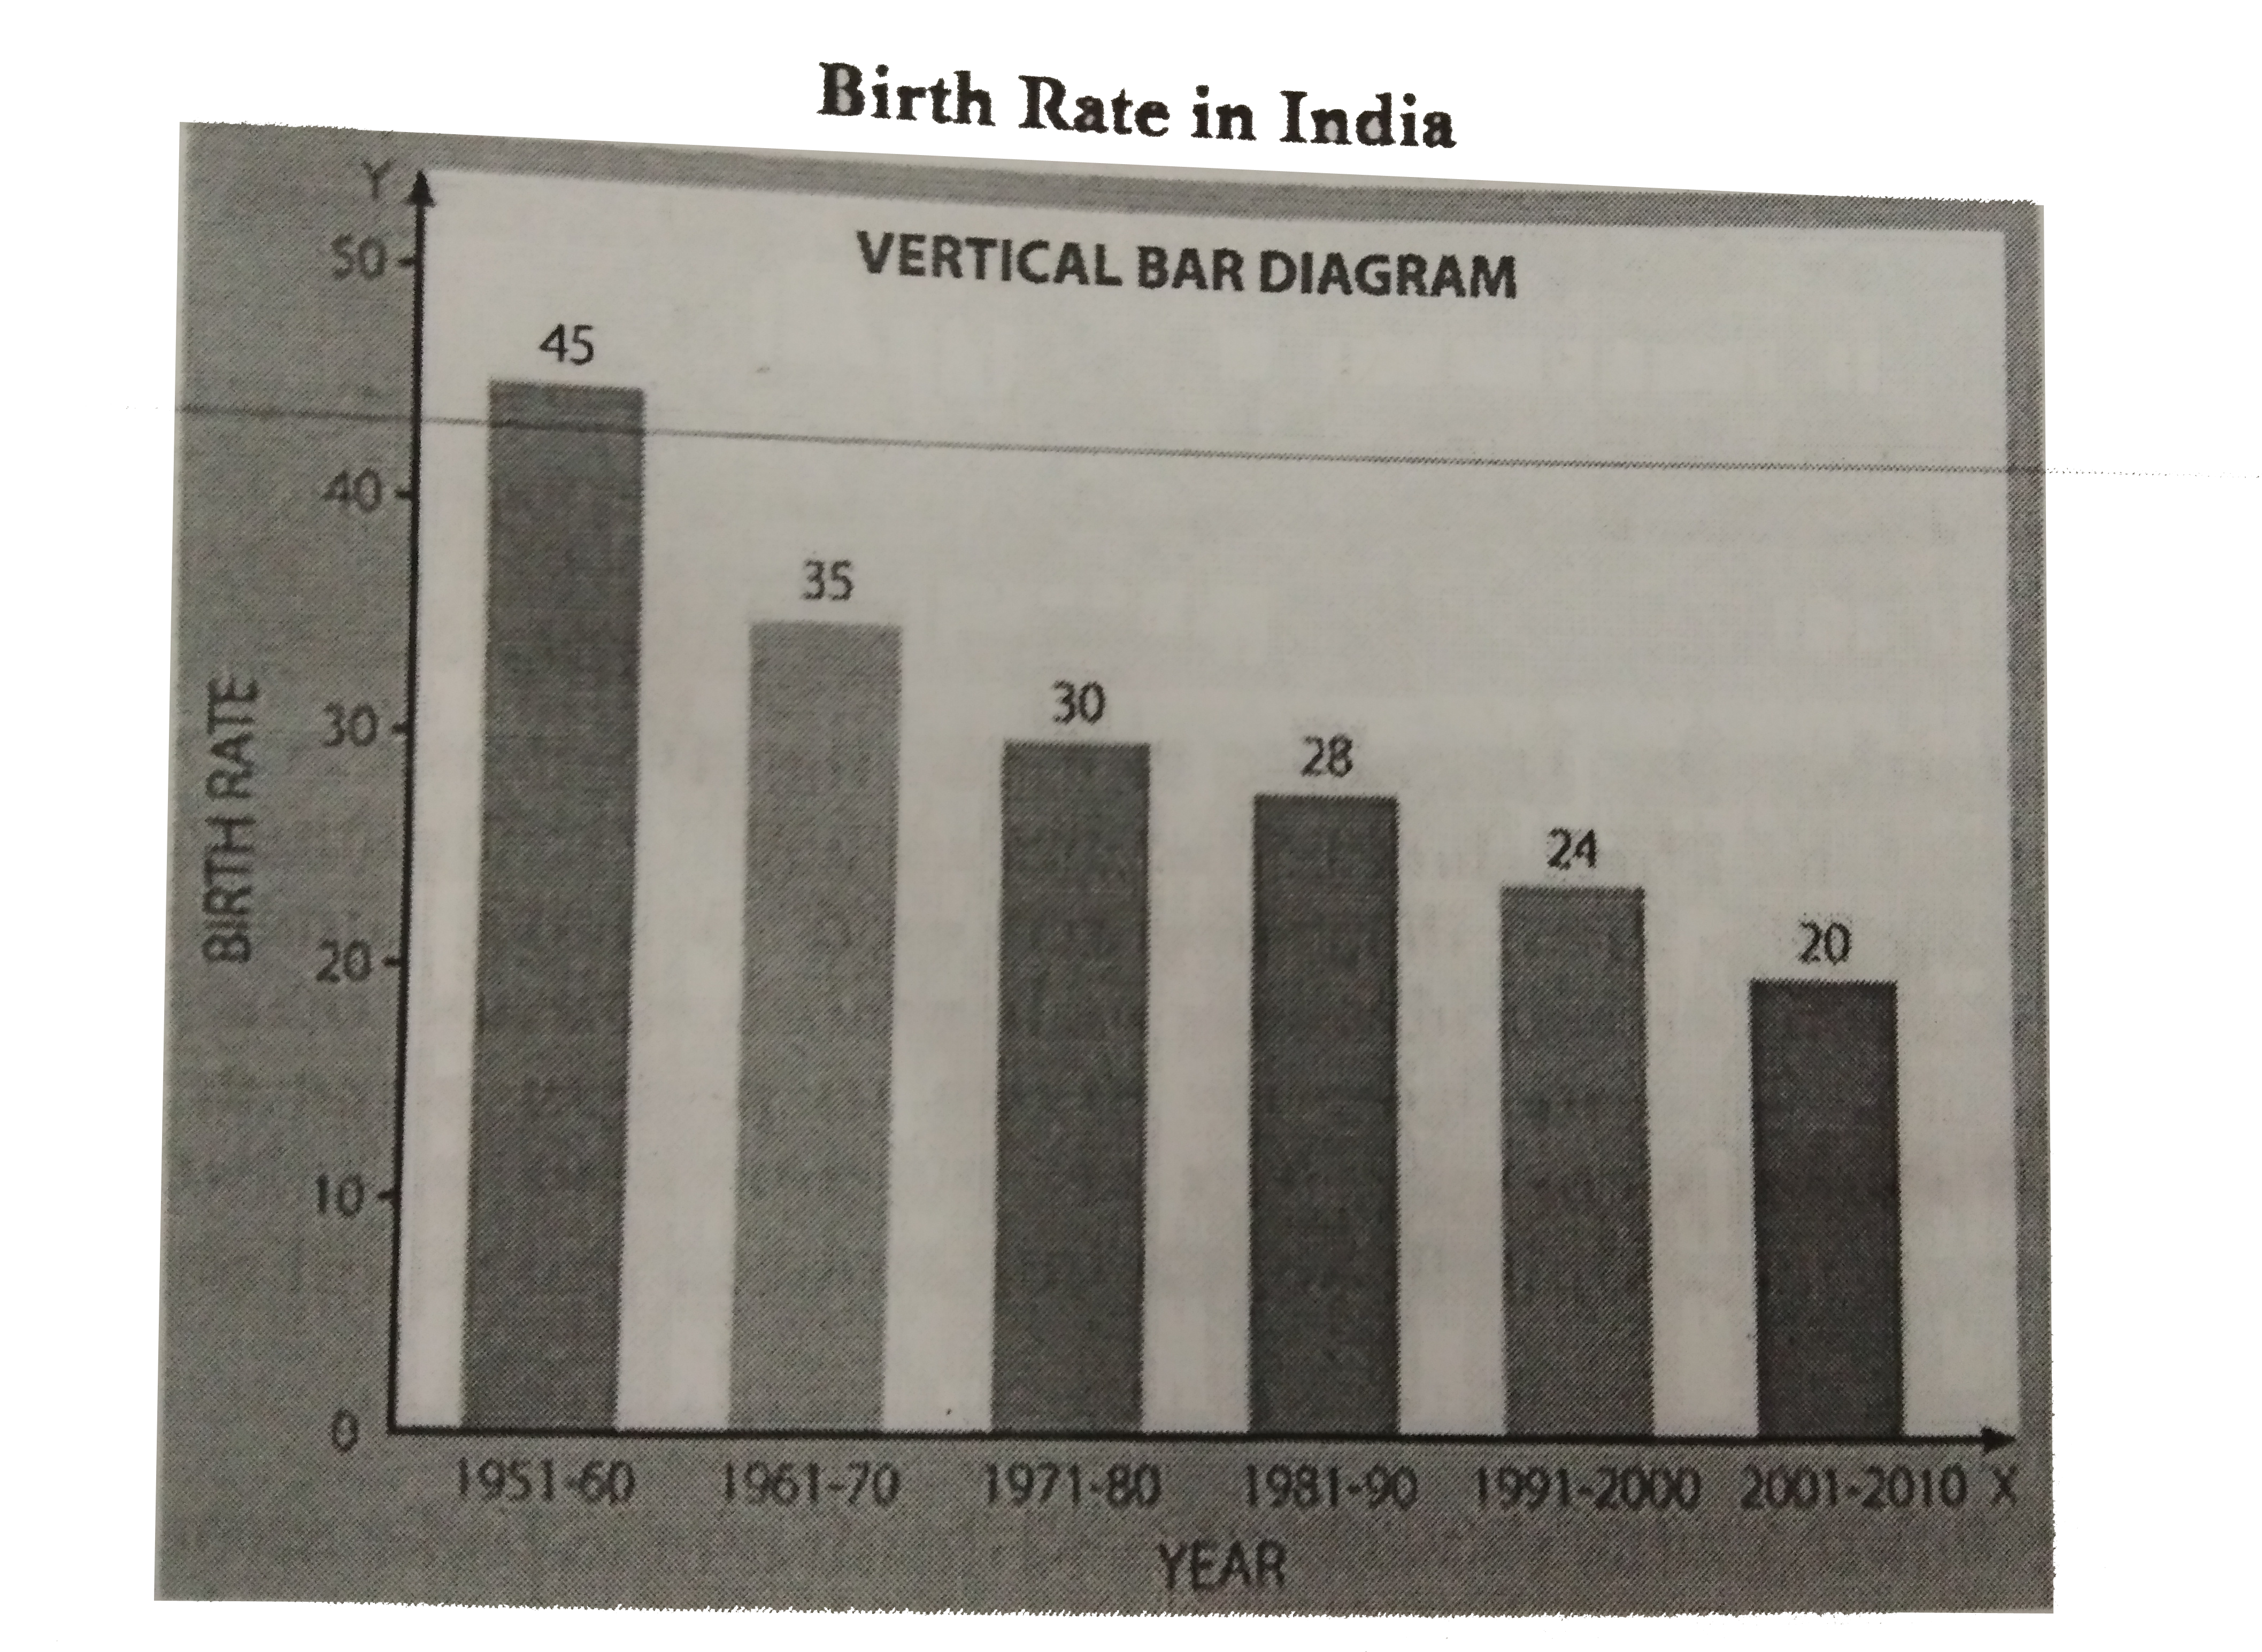
The following table gives data on birth rate in India according to census survey of different years. Present the information the form of a vertical/simple bar diagram.

Topper's Solved these Questions
- BOOK - TARUN JAIN & VK OHRICHAPTER - DIAGRAMMATIC PRESENTATION OF DATA BAR DIAGRAMS AND PIE DIAGRAMSEXERCISE - Essential praticals1videos
DIAGRAMMATIC PRESENTATION OF DATA BAR DIAGRAMS AND PIE DIAGRAMS
- BOOK - TARUN JAIN & VK OHRICHAPTER - DIAGRAMMATIC PRESENTATION OF DATA BAR DIAGRAMS AND PIE DIAGRAMSEXERCISE - Long Answer Type Question10videos
DIAGRAMMATIC PRESENTATION OF DATA BAR DIAGRAMS AND PIE DIAGRAMS
- BOOK - TARUN JAIN & VK OHRICHAPTER - CORRELATIONEXERCISE - NCERT Questions (with Hints to Answers)10videos
CORRELATION
- BOOK - TARUN JAIN & VK OHRICHAPTER - FREQUENCY DIAGRAMS - HISTOGRAM, POLYGON AND OGIVEEXERCISE - EXERCISE NCERT7videos
FREQUENCY DIAGRAMS - HISTOGRAM, POLYGON AND OGIVE
Similar Questions
Present the following data in the form of a multiple bar diagrm:
 View Solution
Present the following data in the form of horizontal bar diagram :
 View Solution
Following are the data about the number of men and women in different age groups in a society. Present the information in the form of a two-way table.
 View Solution
The following table shows birth and death rate in India according to the Census Reports between 1931 - 40 to 2016-17 (hypothetical figures). Present the data in te form of a multiple bar diagram.
 View Solution
The following table shows the monthly expenditure of different families on different items :

Represent the data in the form of a sub-divided bar diagram.View SolutionFollowing information relates to the marks secured by 50 students in economics. Present the information in the form of a table.
 View Solution
Following information relates to the production of wheat and Rice in India in different years. Present it in the form of a table.
 View Solution
Following data relate to the construction of a house in delhi .present the information in the form of a pie diagram:
 View Solution
Following table gives hypothetical figures of exports from India during the years 2013-14 to 2017-18. Present the information in the form of a suitable graph.
Year2013−142014−152015−162016−172017−18Exports (Rs. core)600640670780900View SolutionFollowing tables shows estimates of cost of production of certain commodities. Present the data in the form of sub divided bar diagram:
 View Solution


