Table given below show the mean net primary productivity of certain biomes. Analyse the table and answer the following questions.

a. Tropical rain forest is less productive than tropical deciduous forest. Evaluate.
b. Why does the desert biome become less productive ?
c. Life never exists without plants. Justify.
a. Leaching makes the soil less nutrient and photosynthetic capacity remains the same throughout the year.
b. Due to high temperature.
c. Only plants can convert the solar energy into chemical energy.
Topper's Solved these Questions
- ECOSYSTEM BOOK - NEW JOYTHI PUBLICATIONCHAPTER - ECOSYSTEM EXERCISE - Questions from Previous HSE
10 Videos
- ECOSYSTEM BOOK - NEW JOYTHI PUBLICATIONCHAPTER - ECOSYSTEM EXERCISE - Previous Entrance Exam Corner
13 Videos
- ECOSYSTEM BOOK - NEW JOYTHI PUBLICATIONCHAPTER - ECOSYSTEM EXERCISE - New Evaluation Type Questions
12 Videos
- CBSE QUESTIONS BOOK - NEW JOYTHI PUBLICATIONCHAPTER - CBSE QUESTIONS EXERCISE - BIODIVERSITY AND CONSERVATION
2 Videos
- ENVIRONMENTAL ISSUES BOOK - NEW JOYTHI PUBLICATIONCHAPTER - ENVIRONMENTAL ISSUES EXERCISE - CONTINUOUS EVALUTION (PROJECT)
2 Videos
Similar Questions
Arrange the following ecosystems in the decreasing order of their mean net primary productivity (tons/hectare/year).
I. Tropical deciduous forest
II. Temperate coniferous forest
III. Tropical rain forest.
IV. Temperate deciduous forest
V. Desert scrub.
View SolutionThe table shows the production of different types of cars (in thousands). Study the table carefully and answer the questions

The number of years, in which the production of cars of type B is less than the average production of type D cars ovee the years is :
View Solution
Knowledge Check
Arrange the following ecosystem in terms of their increasing productivity:
1. Grassland
2. Open ocean
3. Desert
4. Tropical rain forest
Select the correct answer code using the codes given below: Answer codes:A3, 2, 1, 4B1, 2, 3, 4C3, 1, 2, 4D4, 1, 2, 3The following graph shows the production of cotton bales of 100 kg each in lakhs by different states A, B, C, D and E over the years. Study the graph and answer the following Questions.
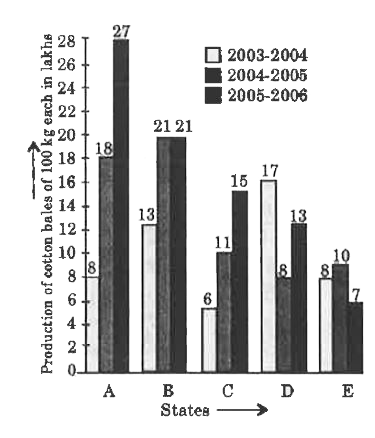
The number of States for which s the production of cotton in 2005 2006 is less than or equal to the preceding year isA3B2C1DThere is no such States
The following table shows the worldwide production of steel in 1920-1927. Study the table and answer the questions.
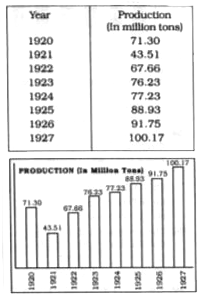
The number of years during which the company has its production less than the average production during 1920-1927 is approximately
View SolutionIn the table, Discount (as a percentage) is give on mark price of these five products by different sellers. Study the table and answer the following questions :
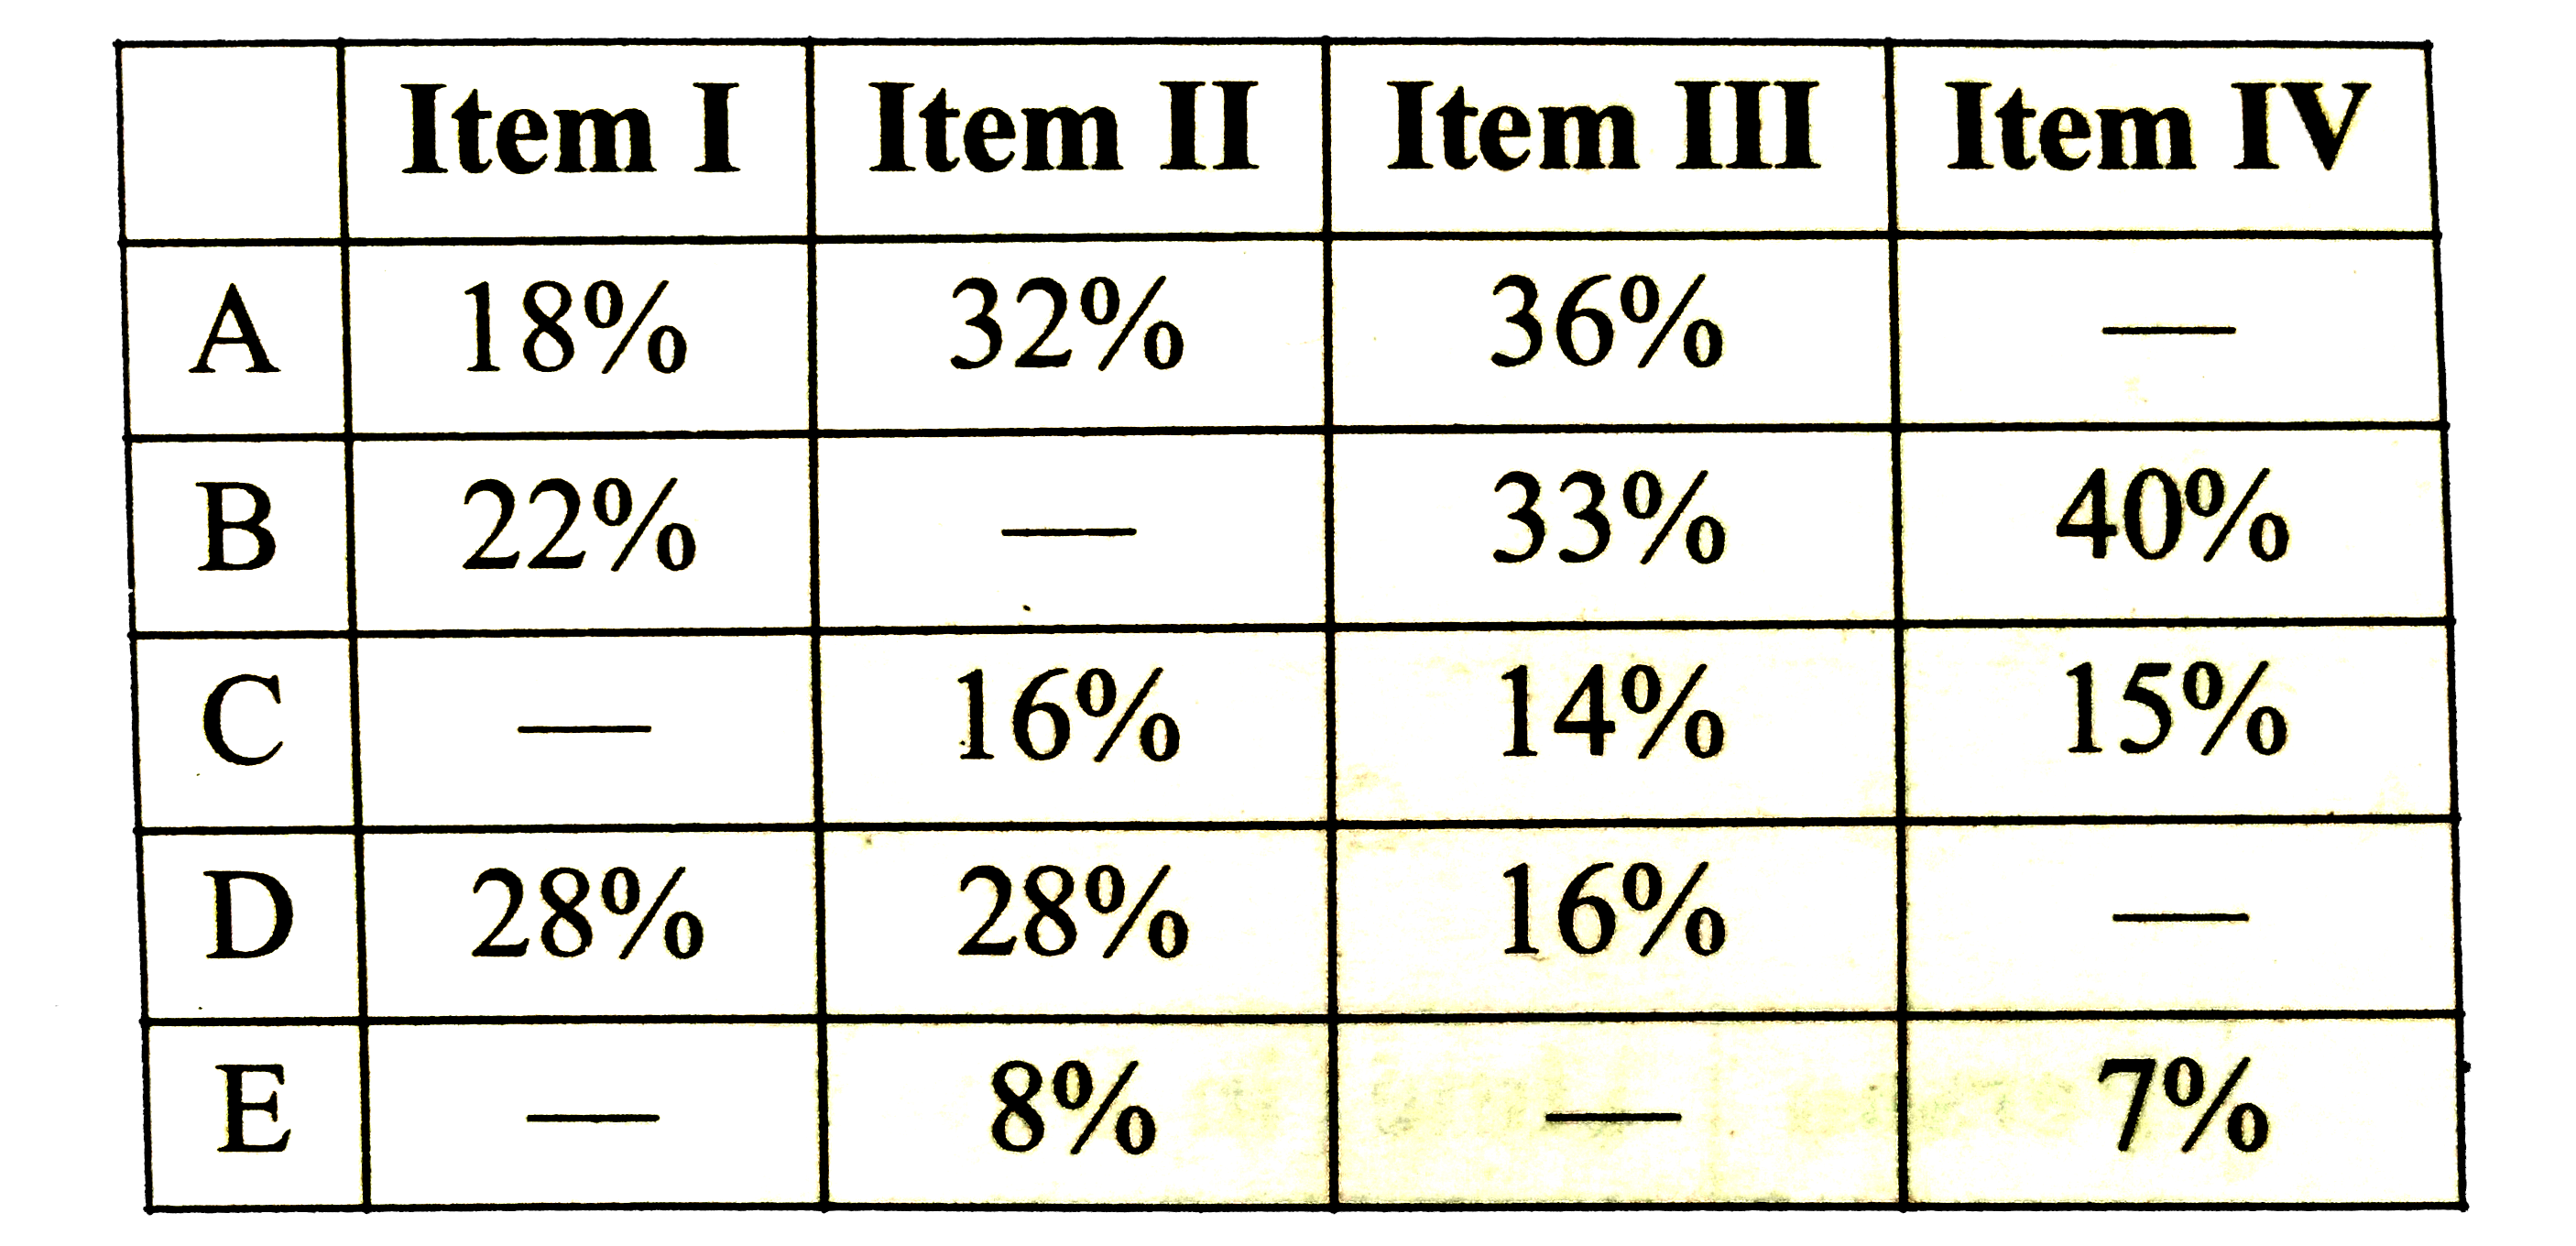
Note : 1 Some values are missing. You have to calculate these values as per data given in the questions.
2 Mark price of a particular item is same for all of the shop owners.
For seller D, between the selling price of item II and that of item III is Rs. 420 if the sum of the mark price of item II and item III by the same seller is 6000 then the Mark price (in Rs) of item II is what percent more/less than that of item III by the same seller ? (Selling price of item II is greaer than that of item III) ?
View SolutionThe data given below shows the production of motor bikes in a factory for some months of two consecutive years.

Study the table given above and answer the following questions:
(a) Draw a double bar graph using appropriate scale to depict the above information and compare them.
(b) In which year was the total output the maximum?
(c) Find the mean production for the year 2007.
(d) For which month was the difference between the production for the two years the maximum?
(e) In which month for the year 2008, the production was the maximum?
(l) In which month for the year 2007, the production was the least?
View SolutionGlucose is the main product of photosynthesis. With reference to this statement, answer the following questions.
(a) Leaves are found to possess very less or no glucose in them when they are tested. Justify this contradiction.
(b) In which form is carbohydrate translocated through phloem tissue in the plant? Why?
View SolutionThe following graph shows the production of cotton bales of 100 kg each (in lakhs) by different states A, B, C, D and E over the years. Study the graph and answer the following Questions.
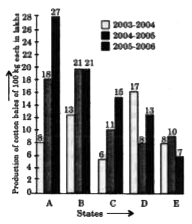
The number of State for which the production of cotton in 2005-2006 is less than or equal to the preceding year is
View SolutionThe given table shows the number (in thousands) of cars of five different models A, B, C, D and E produced during years 2012-2017. Study the table and answer the questions that follow.
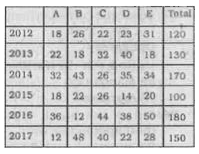
The percentage decrease in the production of which type of car in 2017, with reference to 2016, was the maximum
View Solution
