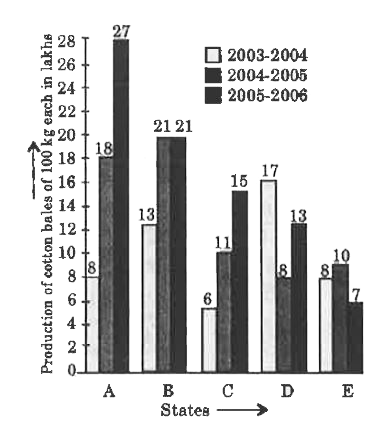
The following graph shows the production of cotton bales of 100 kg each (in lakhs) by different states A, B, C, D and E over the years. Study the graph and answer the following Questions.
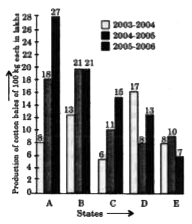
The number of State for which the production of cotton in 2005-2006 is less than or equal to the preceding year is
3
2
1
There is so such State
The correct Answer is:B
Step by step video & image solution for The following graph shows the production of cotton bales of 100 kg each (in lakhs) by different states A, B, C, D and E over the years. Study the graph and answer the following Questions. The number of State for which the production of cotton in 2005-2006 is less than or equal to the preceding year is by Maths experts to help you in doubts & scoring excellent marks in Class 14 exams.
Updated on:21/07/2023Topper's Solved these Questions
- STATISTICS AND DATA INTERPRETATIONBOOK - KIRAN PUBLICATIONCHAPTER - STATISTICS AND DATA INTERPRETATIONEXERCISE - TYPE-V
38 Videos
- STATISTICS AND DATA INTERPRETATIONBOOK - KIRAN PUBLICATIONCHAPTER - STATISTICS AND DATA INTERPRETATIONEXERCISE - TYPE-VI
86 Videos
- STATISTICS AND DATA INTERPRETATIONBOOK - KIRAN PUBLICATIONCHAPTER - STATISTICS AND DATA INTERPRETATIONEXERCISE - TYPE-III
39 Videos
- SIMPLIFICATIONBOOK - KIRAN PUBLICATIONCHAPTER - SIMPLIFICATIONEXERCISE - TEST YOURSELF
25 Videos
- TIME AND DISTANCEBOOK - KIRAN PUBLICATIONCHAPTER - TIME AND DISTANCEEXERCISE - Type -XI
74 Videos
Similar Questions
The following graph shows the production of cotton bales of 100 kg each (in lakhs) by different states A, B, C, D and E over the years. Study the graph and answer the following Questions.
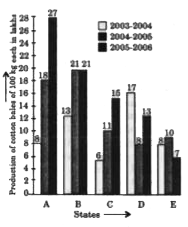
The production of State C in 2003-2004 is how many times its production in 2005-2006 ?
View SolutionThe following graph shows the production of cotton bales of 100 kg each (in lakhs) by different states A, B, C, D and E over the years. Study the graph and answer the following Questions.
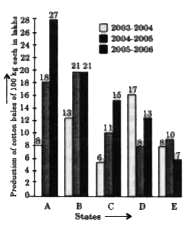
In which State(s) is there a steady increase in the production of cotton during the given period ?
View Solution
Knowledge Check
The following graph shows the production of cotton bales of 100 kg each in lakhs by different states A, B, C, D and E over the years. Study the graph and answer the following Questions.
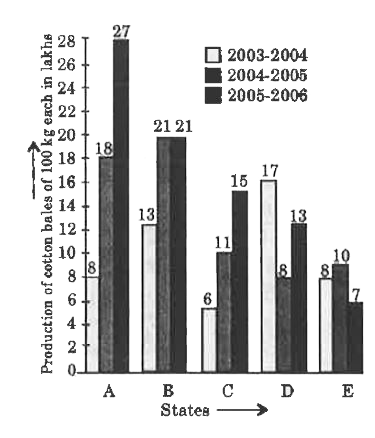
The number of States for which s the production of cotton in 2005 2006 is less than or equal to the preceding year isA3B2C1DThere is no such StatesThe following graph shows the production of cotton bales of 100 kg each in lakhs by different states A, B, C, D and E over the years. Study the graph and answer the following Questions.
The production of State C in 2003-2004 is how many times its production in 2005-2006 ?A2.5B1.85C1.5D0.4The following graph shows the production of cotton bales of 100 kg each in lakhs by different states A, B, C, D and E over the years. Study the graph and answer the following Questions.
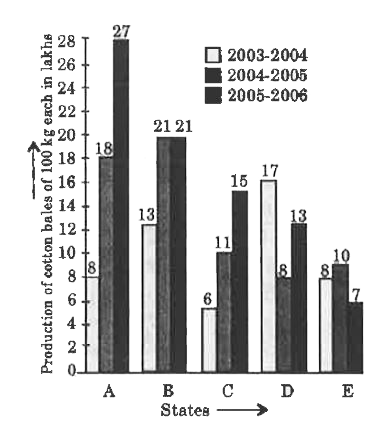
In which State(s) is there a steady increase in the production of cotton during the given period ?AA and BBB and DCA and CDD and E
The following graph shows the production of cotton bales of 100 kg each (in lakhs) by different states A, B, C, D and E over the years. Study the graph and answer the following Questions.
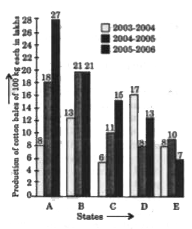
How many kg of cotton was produced by State C during the given period ?
View SolutionRead the graph and answer the following questions
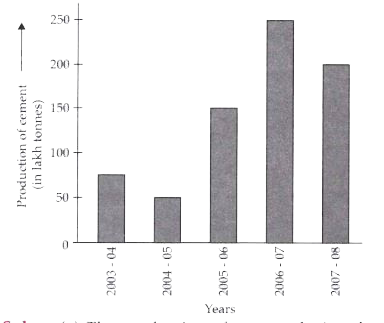
What was the production of cement in the year 2006-07 ?
View SolutionStudy the graph and answer the question
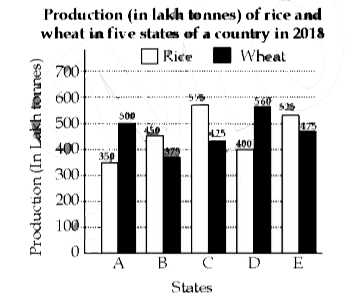
The number of states in which the production of wheat is more than 20% of the total production of rice in all five states is……..
View SolutionThe following graph shows the production of cotton bales of 100 kg each in lakhs by different states A, B, C, D and E over the years. Study the graph and answer the following Questions.
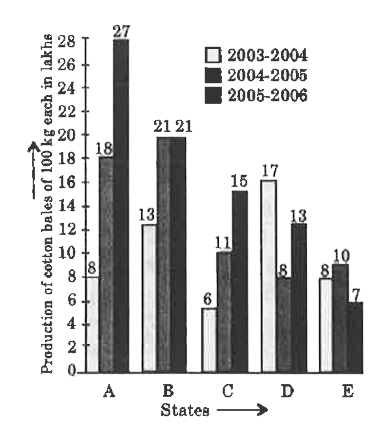
How many kg of cotton was produced by State C during the given period ?
View SolutionStudy the graph and answer the following questions-
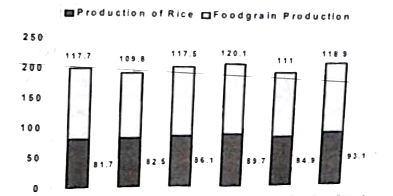
Over the given years what is average production of rice?
View Solution
