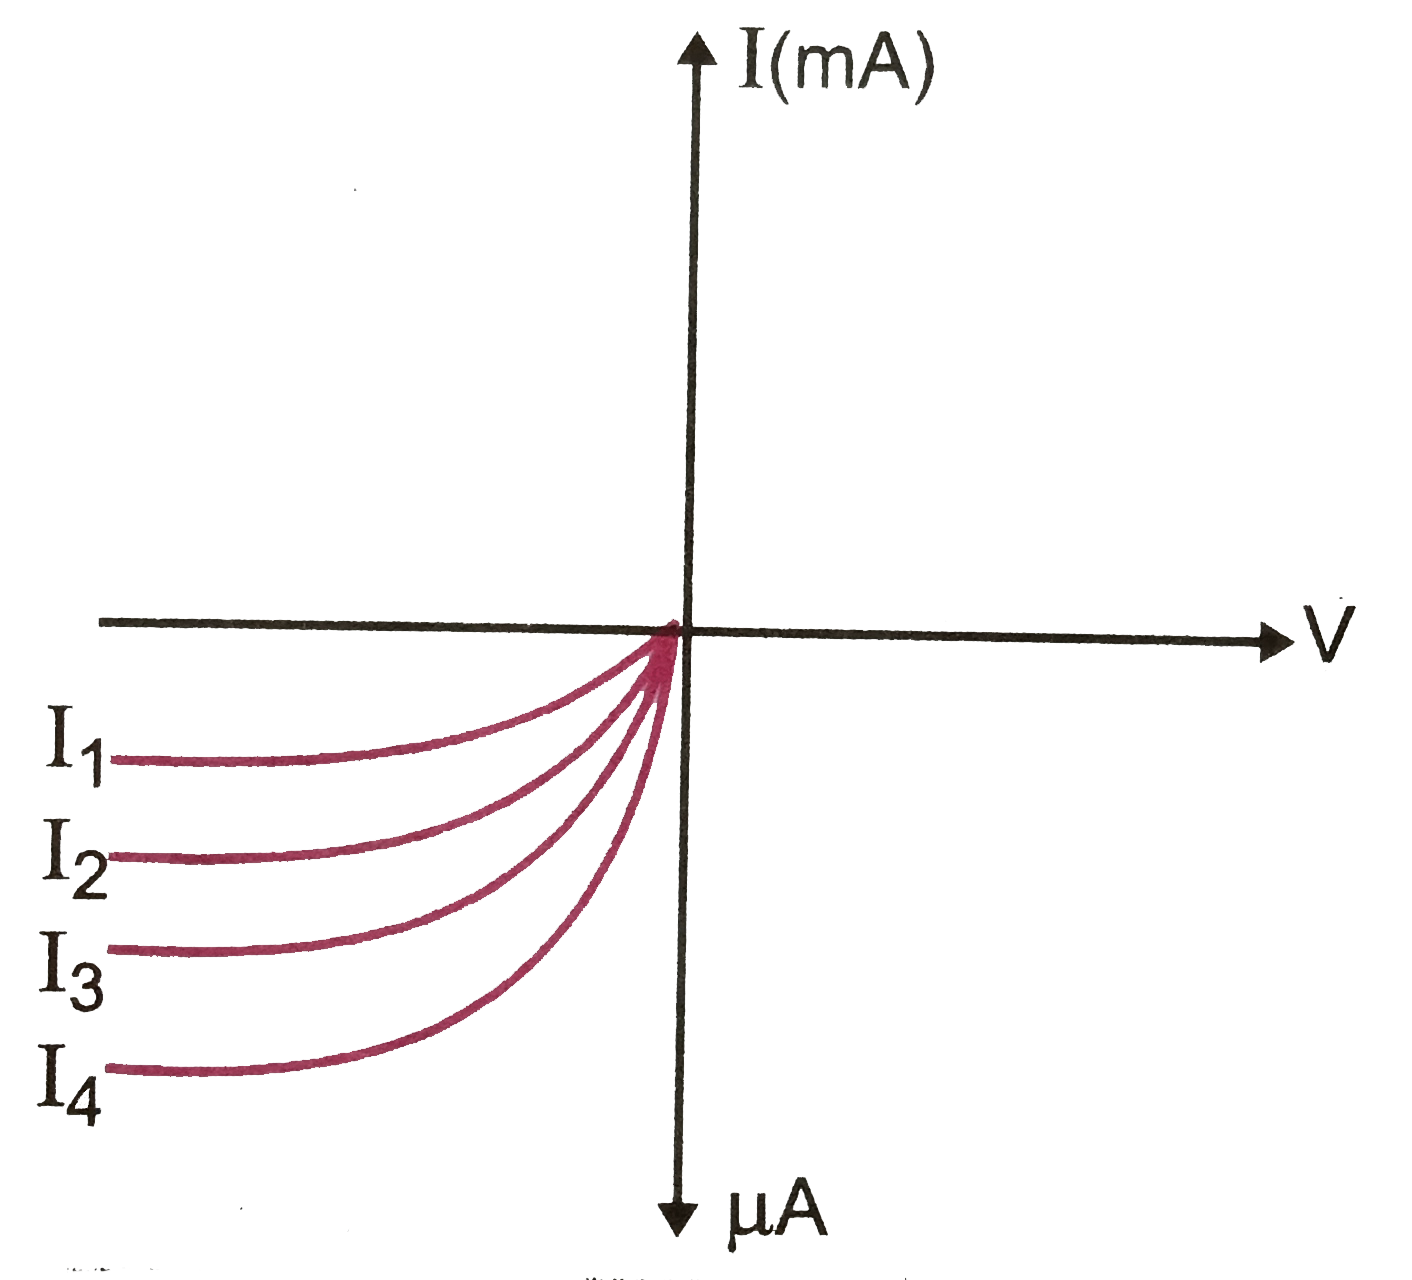
A photodiode is operated in reverse mode under different illumination intensities I1I2I3 and I4 if I1<I2<I3<I4 show reverse bias current for different intensities on a current voltage graph take reverse bias voltage to be same
To solve the problem, we need to illustrate the reverse bias current of a photodiode under different illumination intensities on a current-voltage (I-V) graph. The key points to consider are:
1. Understanding Photodiode Operation: A photodiode operates in reverse bias mode, and the reverse saturation current is directly proportional to the intensity of light incident on it. This means that as the light intensity increases, the reverse saturation current also increases.
2. Given Intensities: We have four different illumination intensities: I1,I2,I3, and I4 such that I1<I2<I3<I4.
3. Reverse Bias Current Relationship: The reverse saturation current Ireverse can be expressed as:
Ireverse∝Iintensity
Therefore, we can denote the reverse saturation currents corresponding to each intensity as:
- For I1: Ireverse1
- For I2: Ireverse2
- For I3: Ireverse3
- For I4: Ireverse4
With the relationships:
Ireverse1<Ireverse2<Ireverse3<Ireverse4
4. Graph Construction: On the I-V graph:
- The x-axis represents the reverse bias voltage (V).
- The y-axis represents the reverse bias current (I).
Since the reverse bias current increases with increasing light intensity, we can plot the points for each intensity:
- At the same reverse bias voltage V, the currents will be:
- Ireverse1 for I1
- Ireverse2 for I2
- Ireverse3 for I3
- Ireverse4 for I4
The graph will show four horizontal lines (or points) at the same reverse bias voltage but at different current levels, where:
Ireverse4>Ireverse3>Ireverse2>Ireverse1
5. Final Representation: The final representation on the I-V graph will show that as we move from I1 to I4, the reverse bias current increases, indicating the relationship between light intensity and reverse saturation current.
Summary of Steps:
1. Understand the operation of a photodiode in reverse bias.
2. Recognize the relationship between light intensity and reverse saturation current.
3. Define the reverse saturation currents for each intensity.
4. Construct the I-V graph with reverse bias voltage on the x-axis and reverse bias current on the y-axis.
5. Plot the points for each intensity, showing that higher intensities correspond to higher reverse bias currents.
Ireverse∝Iintensity
Therefore, we can denote the reverse saturation currents corresponding to each intensity as:
- For I1: Ireverse1
- For I2: Ireverse2
- For I3: Ireverse3
- For I4: Ireverse4
Ireverse1<Ireverse2<Ireverse3<Ireverse4
- The x-axis represents the reverse bias voltage (V).
- The y-axis represents the reverse bias current (I).
- At the same reverse bias voltage V, the currents will be:
- Ireverse1 for I1
- Ireverse2 for I2
- Ireverse3 for I3
- Ireverse4 for I4
Ireverse4>Ireverse3>Ireverse2>Ireverse1
1. Understand the operation of a photodiode in reverse bias.
2. Recognize the relationship between light intensity and reverse saturation current.
3. Define the reverse saturation currents for each intensity.
4. Construct the I-V graph with reverse bias voltage on the x-axis and reverse bias current on the y-axis.
5. Plot the points for each intensity, showing that higher intensities correspond to higher reverse bias currents.
Topper's Solved these Questions
- BOOK - MODERN PUBLICATIONCHAPTER - SEMICONDUCTOR ELECTRONICS METERIALS DEVICES AND SIMPLE CIRCUITS EXERCISE - REVISION EXERCISES (VERY SHORT ANSWER QUESTION)61videos
SEMICONDUCTOR ELECTRONICS METERIALS DEVICES AND SIMPLE CIRCUITS
- BOOK - MODERN PUBLICATIONCHAPTER - SEMICONDUCTOR ELECTRONICS METERIALS DEVICES AND SIMPLE CIRCUITS EXERCISE - REVISION EXERCISES (ADDITOINAL QUESTION)9videos
SEMICONDUCTOR ELECTRONICS METERIALS DEVICES AND SIMPLE CIRCUITS
- BOOK - MODERN PUBLICATIONCHAPTER - SEMICONDUCTOR ELECTRONICS METERIALS DEVICES AND SIMPLE CIRCUITS EXERCISE - NCERT FILE SOLVED (TEXT BOOK EXERCISES )30videos
SEMICONDUCTOR ELECTRONICS METERIALS DEVICES AND SIMPLE CIRCUITS
- BOOK - MODERN PUBLICATIONCHAPTER - RAY OPTICS AND OPTICAL INSTRUMENTSEXERCISE - CHAPTER PRACTICE TEST14videos
RAY OPTICS AND OPTICAL INSTRUMENTS
- BOOK - MODERN PUBLICATIONCHAPTER - WAVE OPTICALEXERCISE - CHAPTER PRACTICE TEST7videos
WAVE OPTICAL
Similar Questions
Why is a photodide operated in reverse bias mode? Fig. shown reverse bias current, under different illuminating intensities I1I2,I3 and I4 for a given photodiode. Average the intensities I1,I2,I3 and I4 in decreasing order of wavelength.
 View Solution
(A) Plot V-I characteristics for an illuminated photo diode under reverse bias for three different illumination intensities I1>I2>I3 . (B) In a zener regulated power supply, a zener diode with V_2 = 6 V is used for regulation. the load current should be 4.0 mA and zener current is five times the load current for unregulated input of 10 V. Find the series resistor R3 used in the power supply.
View Solution
Knowledge Check
- Question 1 - Select One
A photoelectric experiment is performed at two different light intensities I1andI2(I2>I1). Choose the correct graph showing the variation of stopping potential versus frequency of light.
A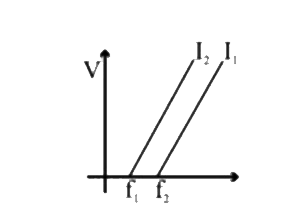 B
B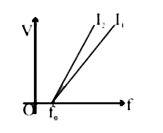 C
C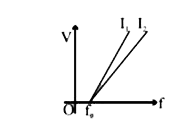 DNone of these
 - Question 2 - Select One
A photoelectric experiment is performed at two different light intensities I1andI2(I2>I1). Choose the correct graph showing the variation of stopping potential versus frequency of light.
A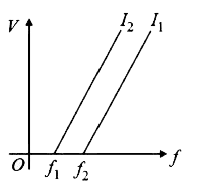 B
B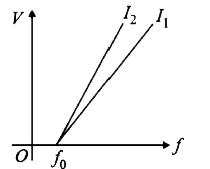 C
C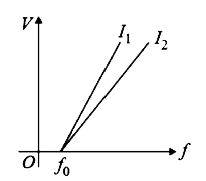 D
D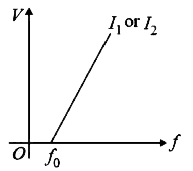
- Question 3 - Select One
In the circuit shown, the value of currents I1,I2andI3 are
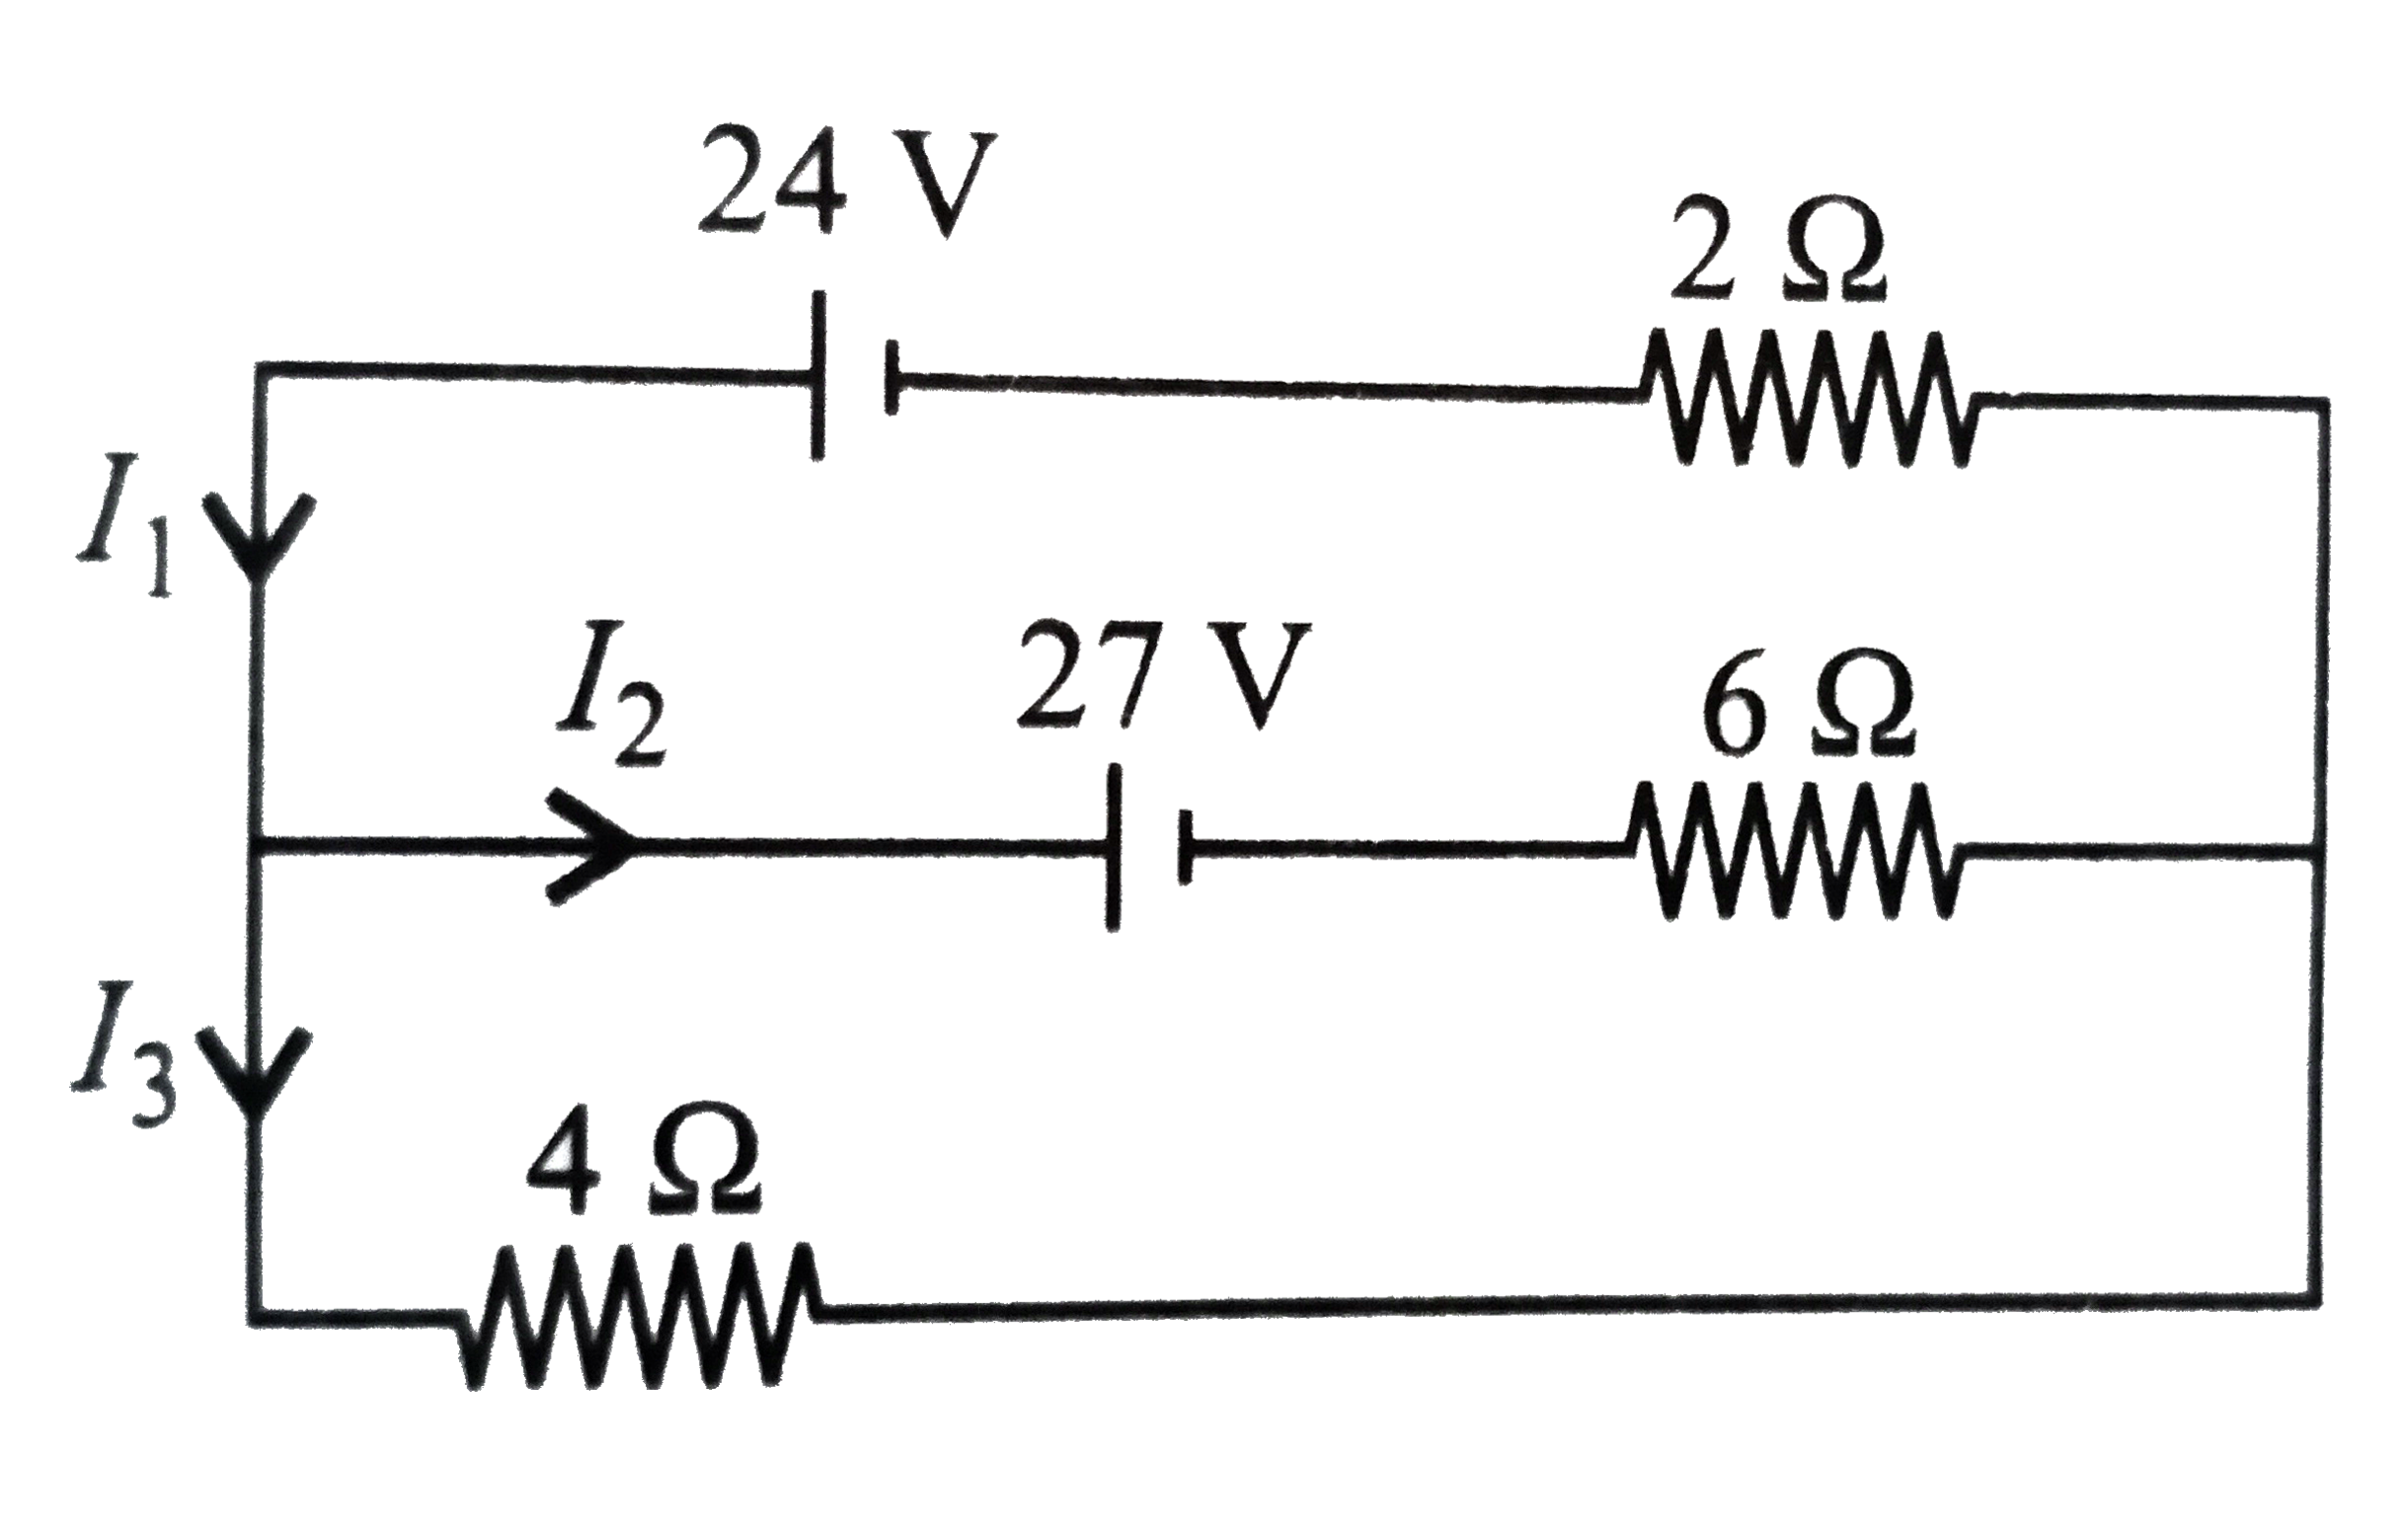 A3A,−3A2A,92AB92A,−32AC5A,4A,−3AD7A,54A,92A
Find relation in between current i1,i2,i3,i4,i5 and i6.
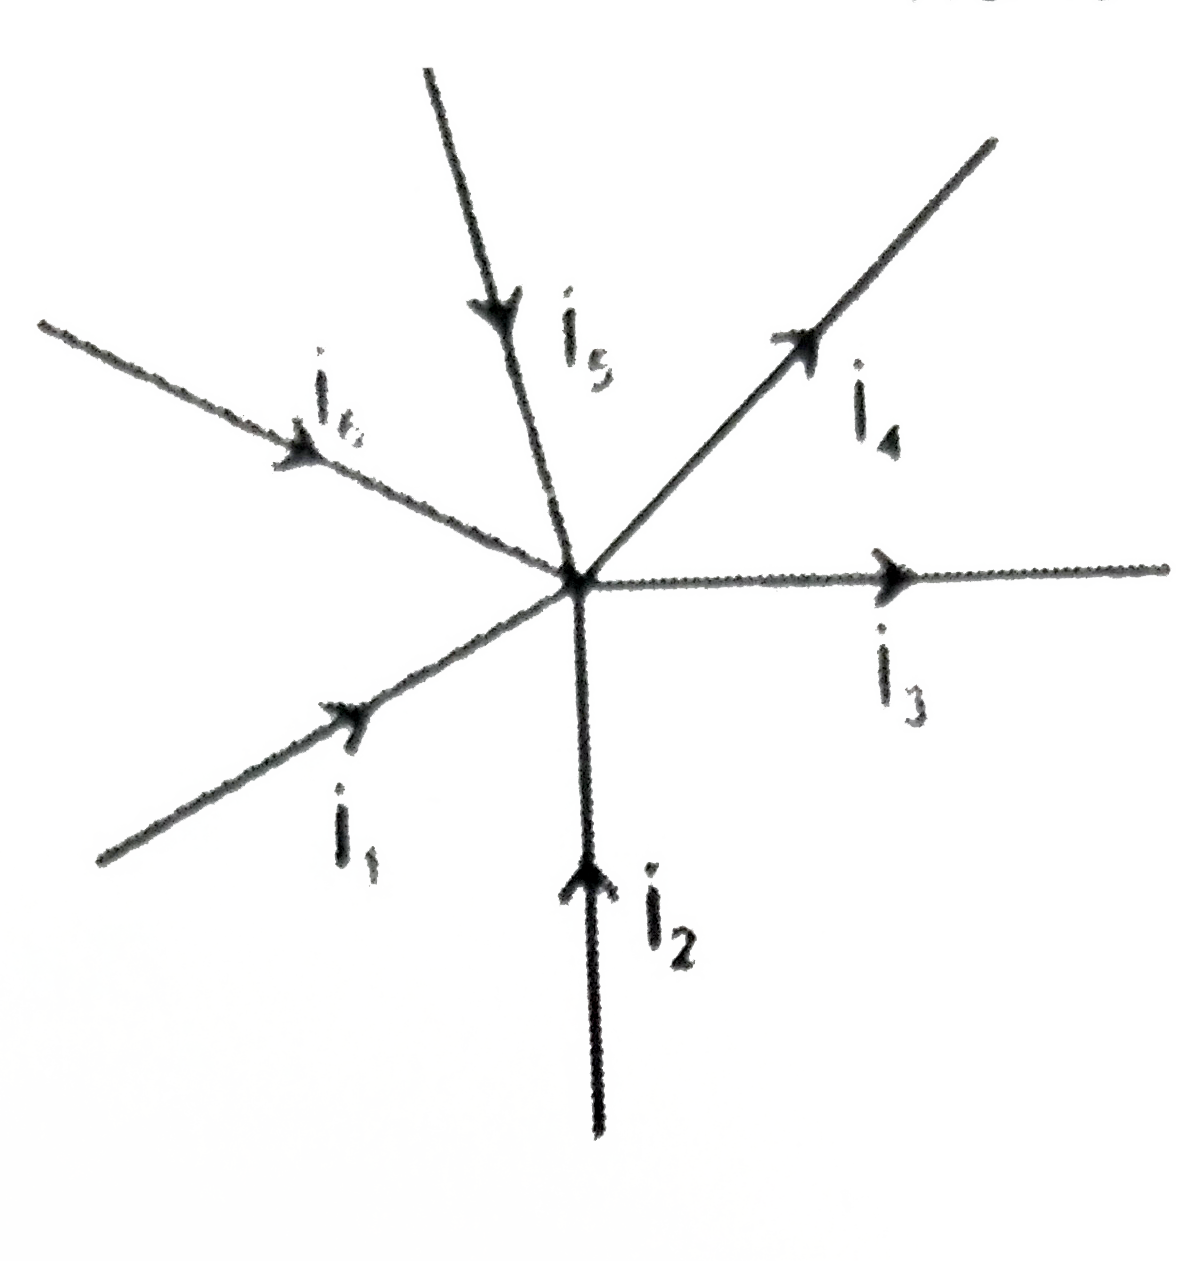 View Solution
Show the biasing of a photodiode with the help of a circuit diagram. Draw graphs to show variation in reverse bias current for different illumination intensities.
View SolutionFind the current I1, I2, & I3, in the circuit.
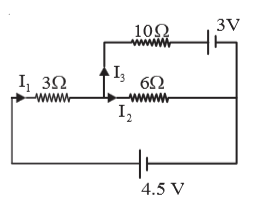 View Solution
In the shown AC circuit phase different between current I1 and I2 is
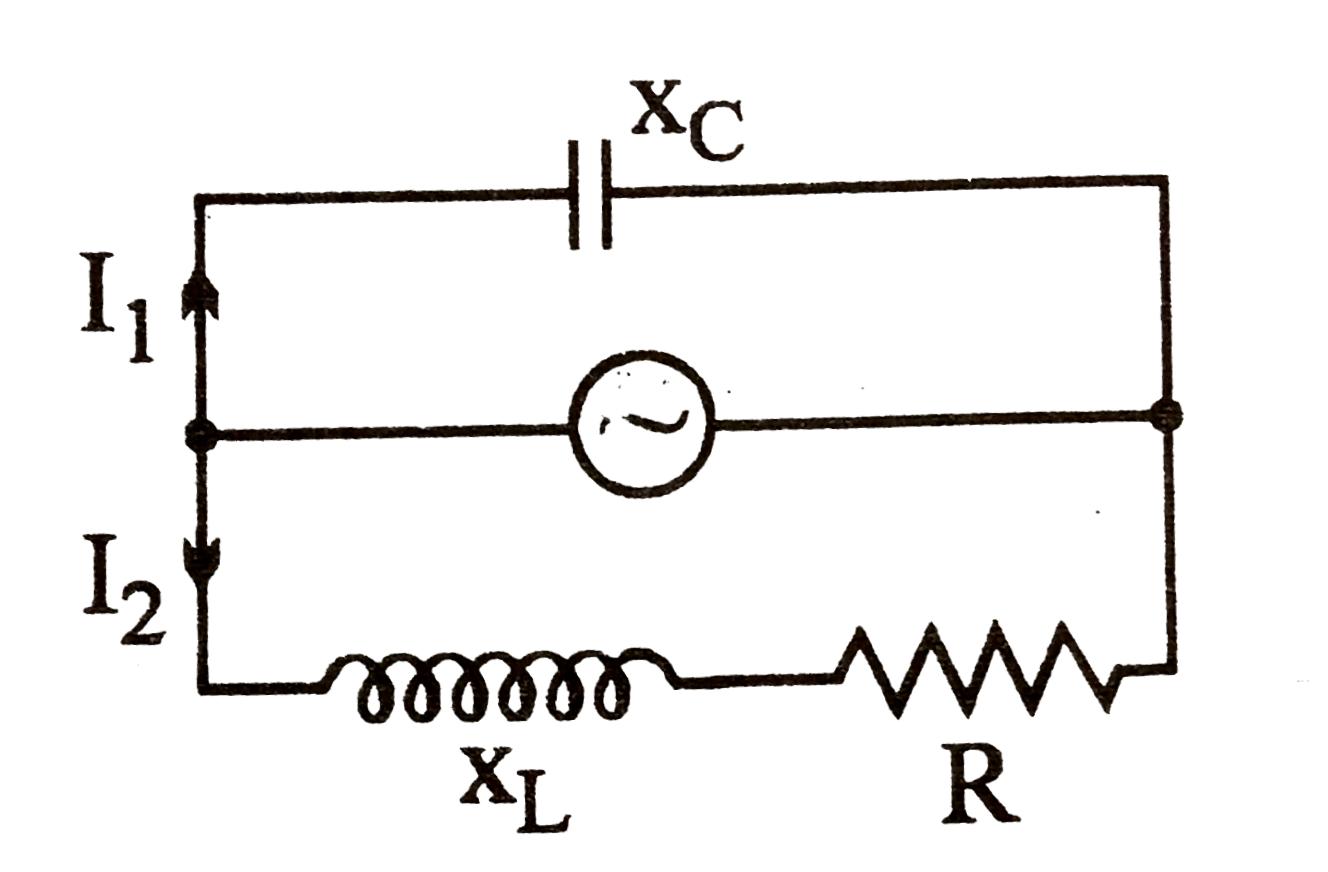 View Solution
The maximum intensities produced by two coherent waves of intensity I1 and I2 will be:
View Solution

