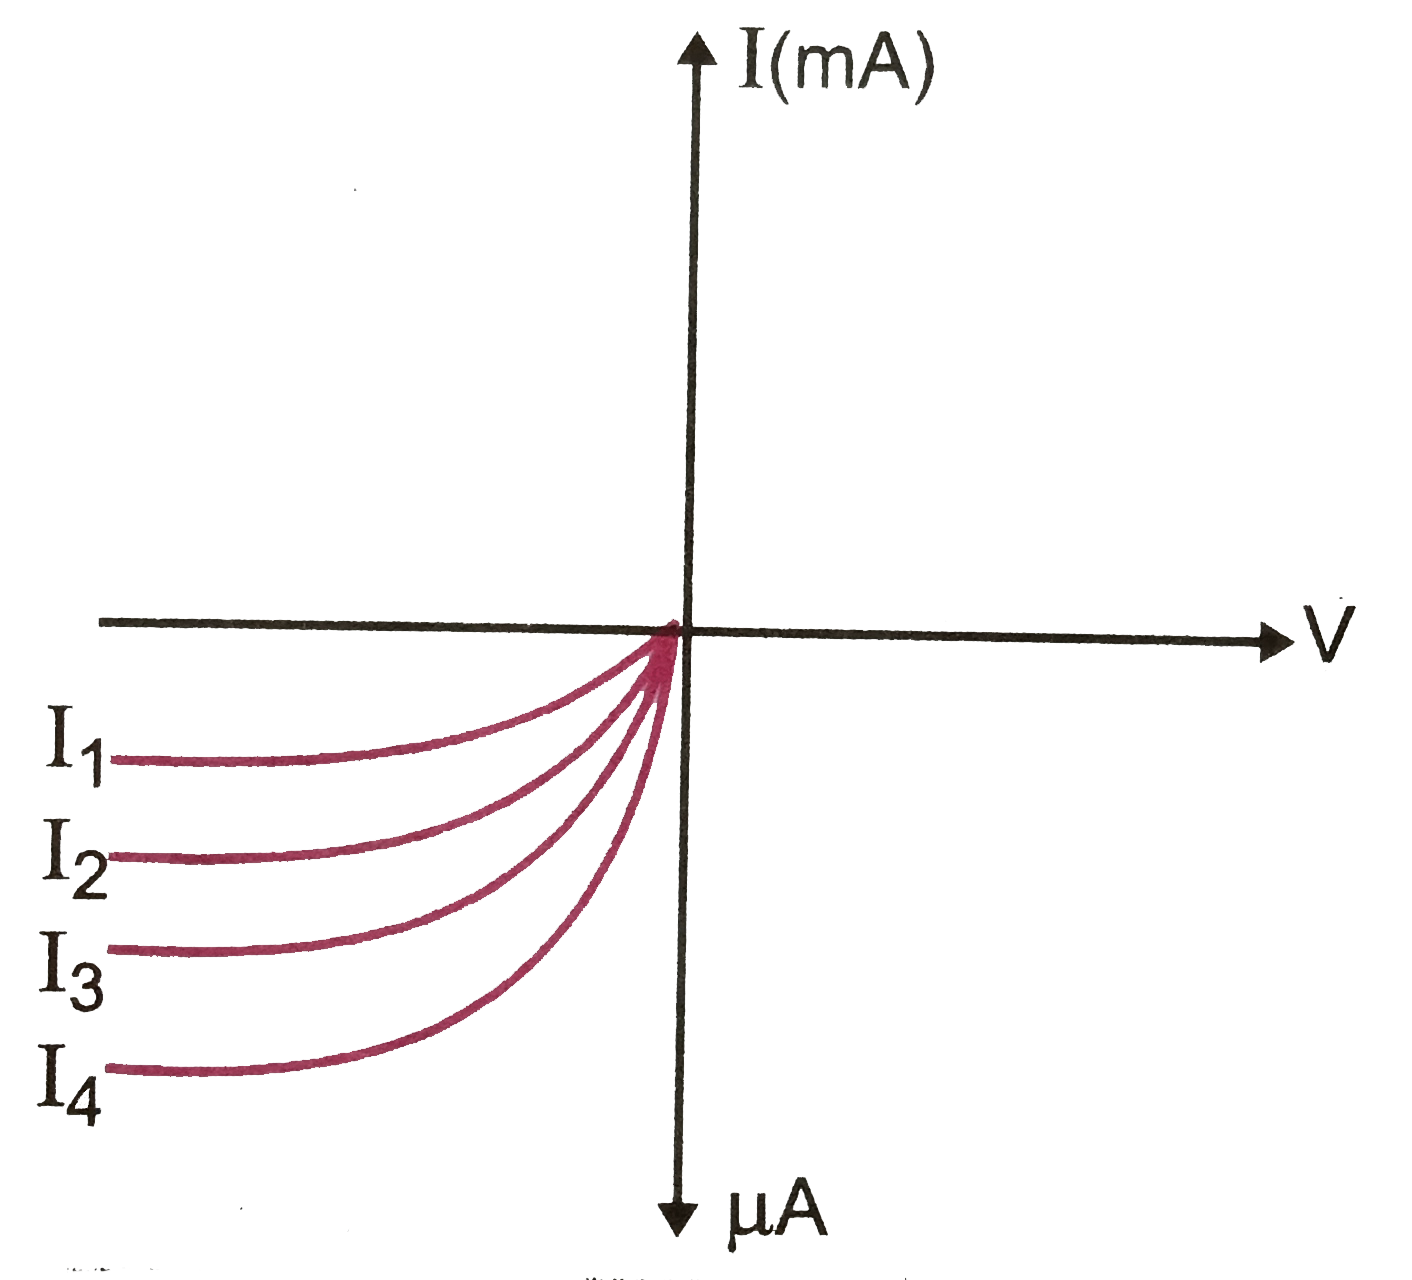
Show the biasing of a photodiode with the help of a circuit diagram. Draw graphs to show variation in reverse bias current for different illumination intensities.
Step-by-Step Solution:
Step 1: Understanding the Photodiode
- A photodiode is a semiconductor device that converts light into an electrical current. It operates in reverse bias, meaning the p-type material is connected to the negative terminal of a power supply and the n-type material is connected to the positive terminal.
Step 2: Circuit Diagram of a Photodiode
- Draw the circuit diagram:
- Represent the photodiode with its symbol (a diode symbol with arrows indicating incident light).
- Connect the p-type side to the negative terminal of a voltage source (V) and the n-type side to the positive terminal.
- Include an ammeter in series to measure the reverse current and a resistor (R) in parallel to the photodiode.
Circuit Diagram:
+V||||||(Pho→diode)|||⊢−−−−−−−−−−−−−−−−−Ammeter(A)|−−−R−−−||GND
Step 3: Biasing the Photodiode
- In reverse bias, the depletion region widens, allowing more incident photons to generate electron-hole pairs. This increases the reverse current as the intensity of light increases.
Step 4: Current-Illumination Intensity Graph
- Draw graphs to show the relationship between reverse bias current and illumination intensity:
- On the x-axis, represent the illumination intensity (I).
- On the y-axis, represent the reverse current (I_R).
- Plot three curves for different illumination intensities (I1, I2, I3) where I3 > I2 > I1.
- As the illumination intensity increases, the reverse current also increases.
Graph Representation:
IR|I3||/|/|/||/I2|/|/|∣/I1⌊__∠____________IIntensity
- A photodiode is a semiconductor device that converts light into an electrical current. It operates in reverse bias, meaning the p-type material is connected to the negative terminal of a power supply and the n-type material is connected to the positive terminal.
- Draw the circuit diagram:
- Represent the photodiode with its symbol (a diode symbol with arrows indicating incident light).
- Connect the p-type side to the negative terminal of a voltage source (V) and the n-type side to the positive terminal.
- Include an ammeter in series to measure the reverse current and a resistor (R) in parallel to the photodiode.
+V||||||(Pho→diode)|||⊢−−−−−−−−−−−−−−−−−Ammeter(A)|−−−R−−−||GND
- In reverse bias, the depletion region widens, allowing more incident photons to generate electron-hole pairs. This increases the reverse current as the intensity of light increases.
- Draw graphs to show the relationship between reverse bias current and illumination intensity:
- On the x-axis, represent the illumination intensity (I).
- On the y-axis, represent the reverse current (I_R).
- Plot three curves for different illumination intensities (I1, I2, I3) where I3 > I2 > I1.
- As the illumination intensity increases, the reverse current also increases.
IR|I3||/|/|/||/I2|/|/|∣/I1⌊__∠____________IIntensity
Topper's Solved these Questions
- ELECTRONIC DEVICES BOOK - CBSE COMPLEMENTARY MATERIALCHAPTER - ELECTRONIC DEVICES EXERCISE - LONG ANSWER QUESTIONS (5 MARKS)
1 Videos
- ELECTRONIC DEVICES BOOK - CBSE COMPLEMENTARY MATERIALCHAPTER - ELECTRONIC DEVICES EXERCISE - NUMERICALS
7 Videos
- ELECTRONIC DEVICES BOOK - CBSE COMPLEMENTARY MATERIALCHAPTER - ELECTRONIC DEVICES EXERCISE - SHORT ANSWER QUESTIONS (2 MARKS)
13 Videos
- ELECTROMAGNETIC WAVES AND OPTICSBOOK - CBSE COMPLEMENTARY MATERIALCHAPTER - ELECTROMAGNETIC WAVES AND OPTICSEXERCISE - 1 mark question
11 Videos
- ELECTROSTATICS AND CURRENT ELECTRICITY BOOK - CBSE COMPLEMENTARY MATERIALCHAPTER - ELECTROSTATICS AND CURRENT ELECTRICITY EXERCISE - NUMERICALS
49 Videos
Similar Questions
Explain (i) forward biasing (ii) reverse biasing of a P-N junction diode. With the help of a circuit diagram, explain the use of this device as a half wave rectifier.
View SolutionWhy is a photodide operated in reverse bias mode? Fig. shown reverse bias current, under different illuminating intensities I1I2,I3 and I4 for a given photodiode. Average the intensities I1,I2,I3 and I4 in decreasing order of wavelength.

View SolutionDraw graph showing variation of voltage and current with time over one cycle of ac.for X
View SolutionIs the graph showing variation of current versus voltage for a diode linear or non-linear?
View SolutionPlot a graph showing variation of current versus voltage for the material GaAs
View SolutionPlot a graph showing variation of current versus voltage for the material Ga.
View SolutionDraw a graph to show the variation of E with perpendicular distance r from line of charge.
View SolutionDraw the circuit diagram of an illuminated photodiode in reverse bias? How is photodiode used to measure light intensity?
View SolutionWith the help of a neat circuit diagram, explain the working of a photodiode. State its any'two uses.
View SolutionDraw a graph showing the variation of decay rate with number of active nuclei.
View Solution
