If the graph of the function y=f(x) is as shown : the graph of y=12(|f(x)|−f(x)) is
Step by step video & image solution for If the graph of the function y = f(x) is as shown : the graph of y = 1/2( |f(x)| - f(x)) is by Maths experts to help you in doubts & scoring excellent marks in Class 12 exams.
Updated on:21/07/2023Topper's Solved these Questions
Similar Questions
Given the graph of the function y=f(x), draw the graph of y=sgn(x).
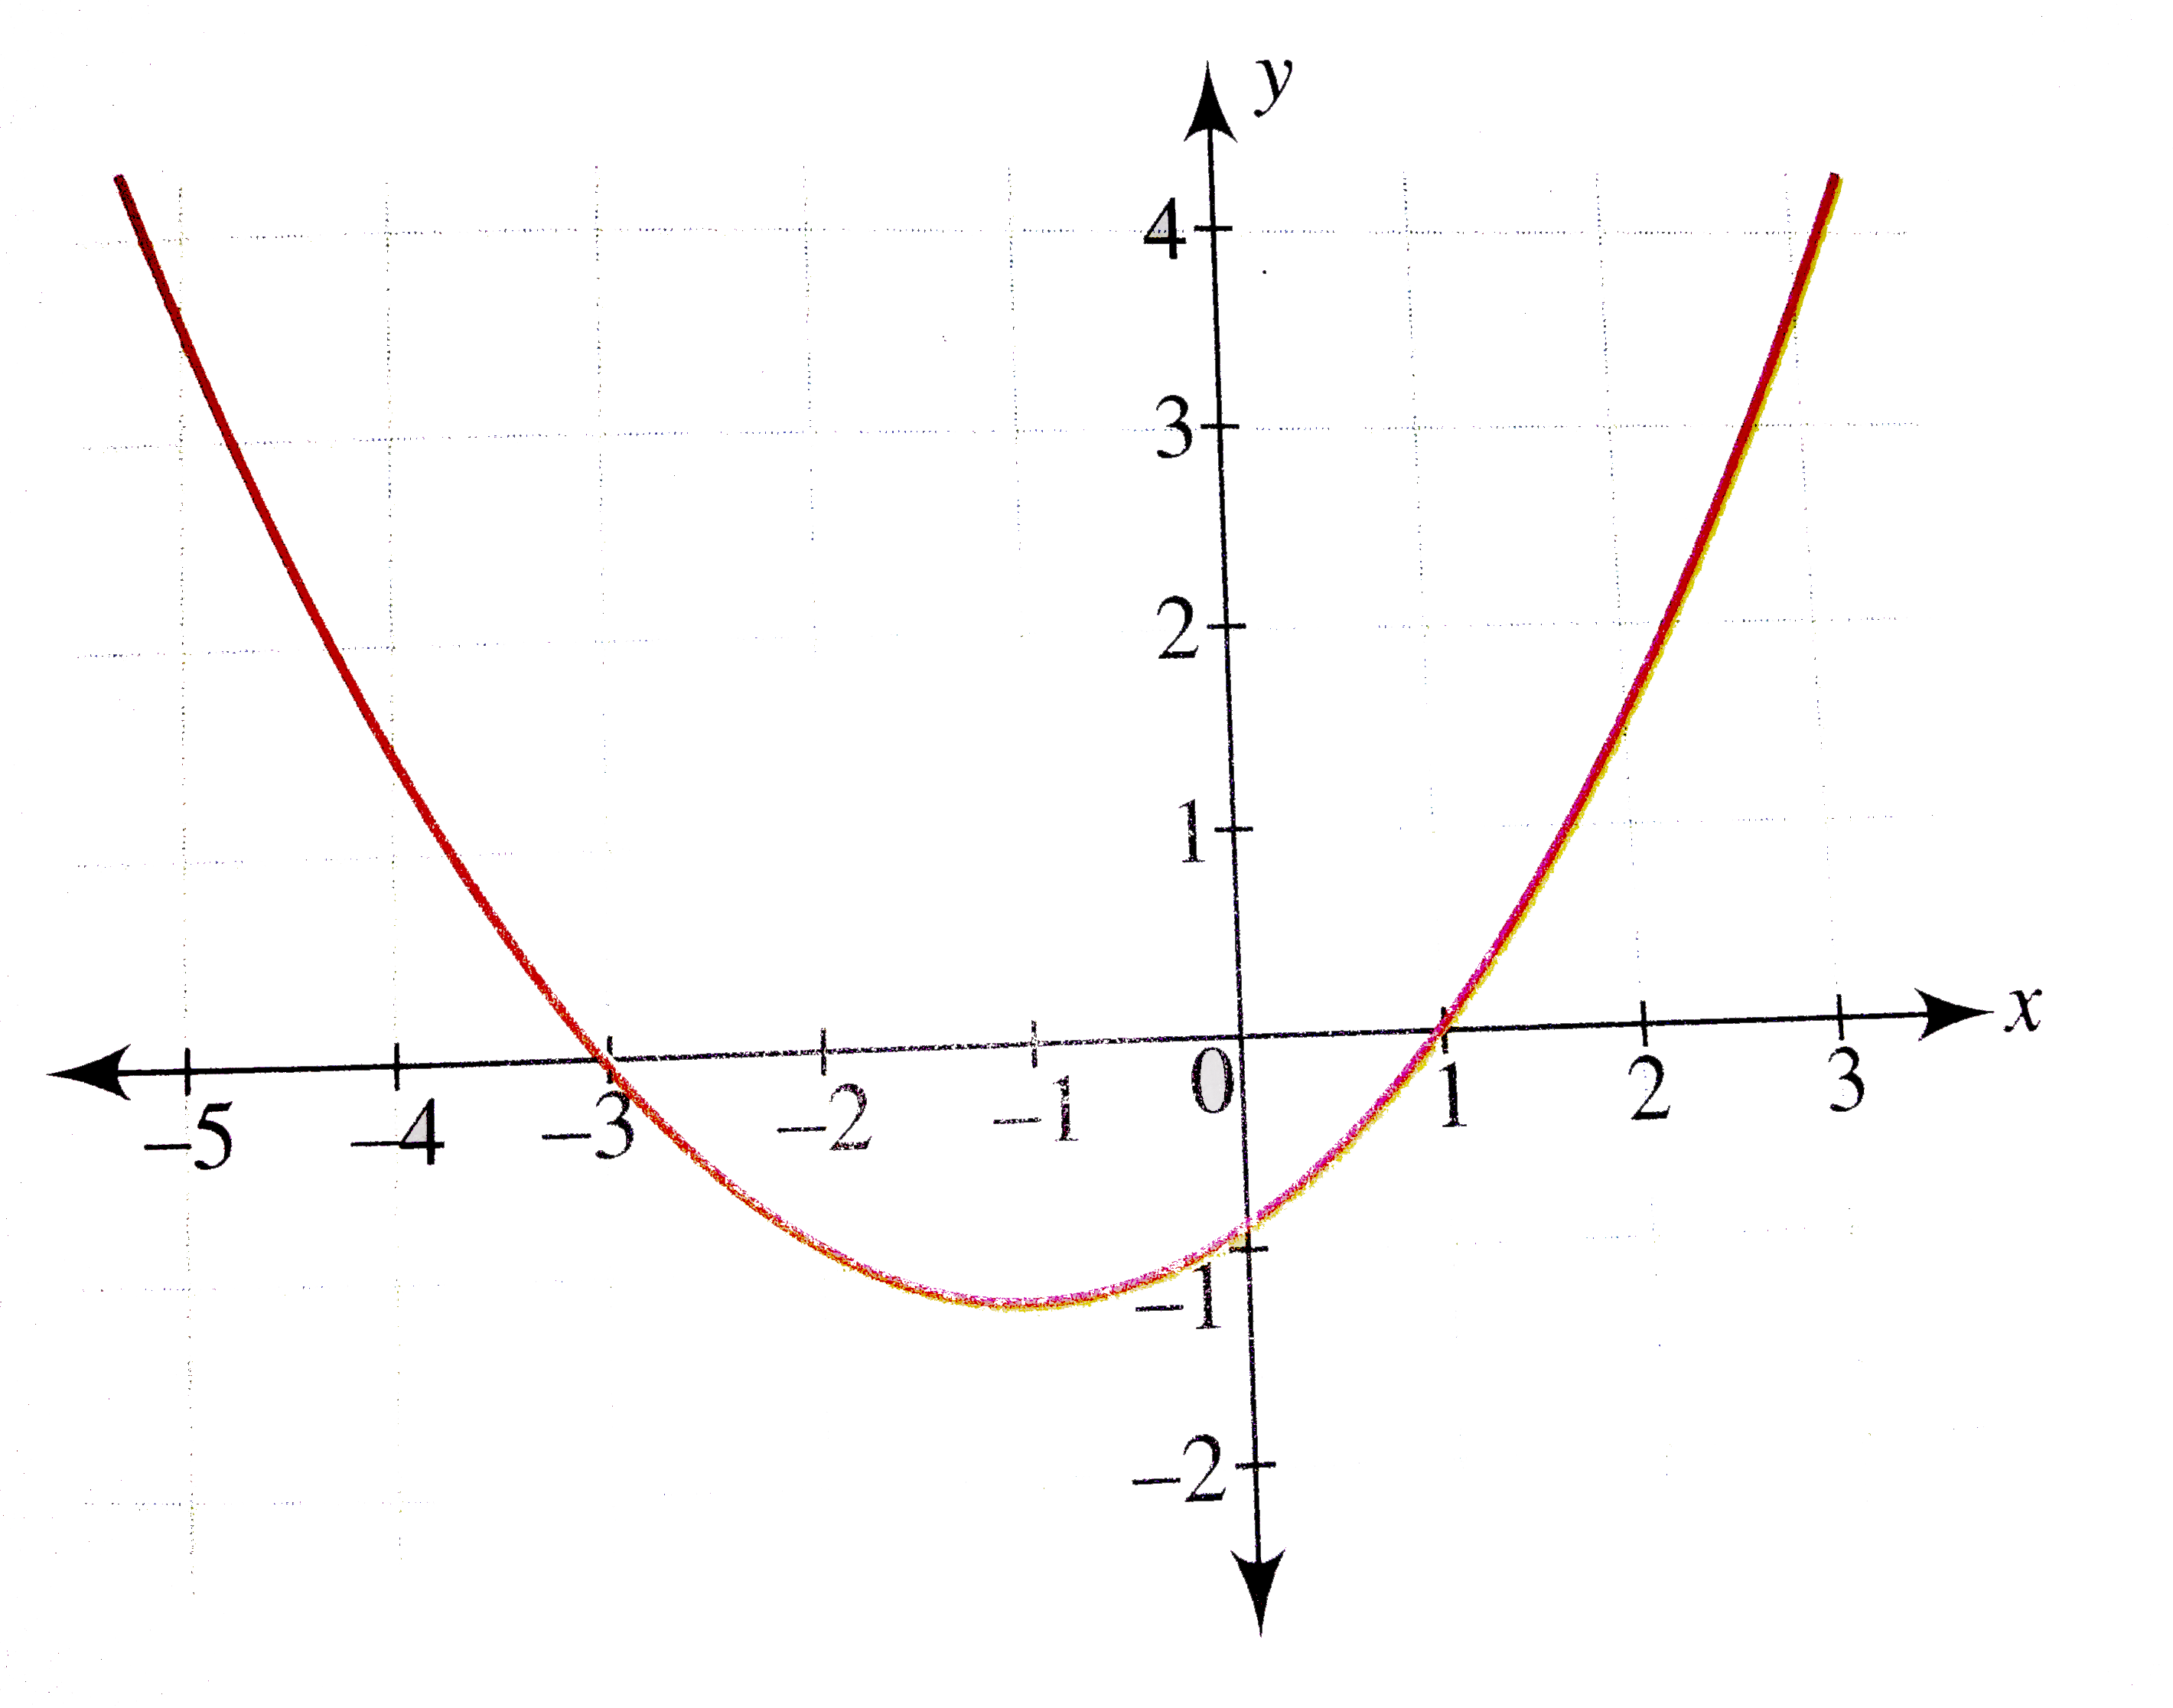
View SolutionThe graph of the function f(x)=−2−|x|
View SolutionThe graph y = f (x) is as shown:
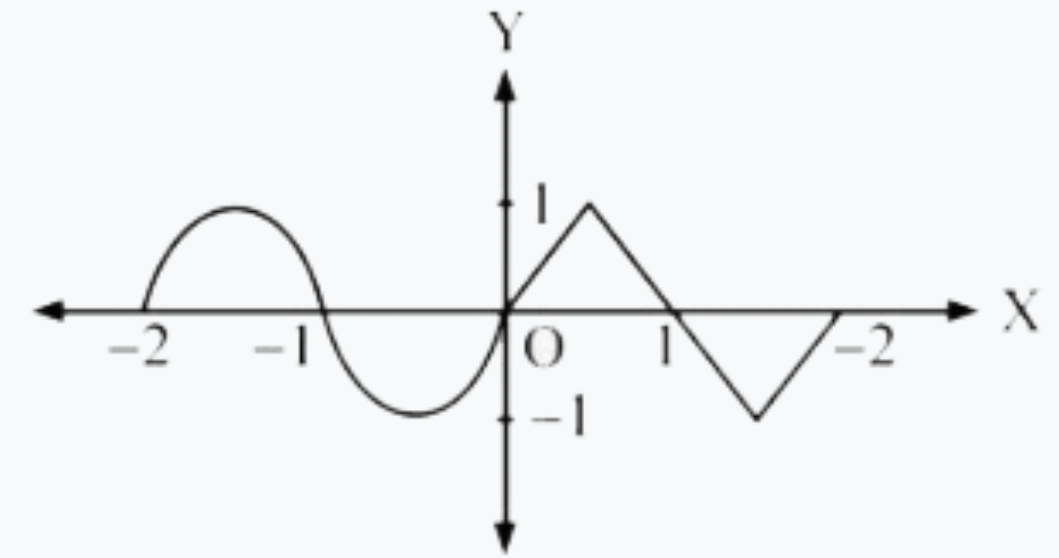
The graph of y = f (–|x|) is:
View SolutionThe graph of function f(x) is shown below :
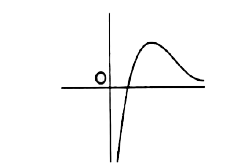
Then the graph of g(x)=1f(|x|) is:
View SolutionThe graph of function f(x) is shown below :

Then the graph of g(x)=1f(|x|) is:
View SolutionGiven the graph of y=f(x)
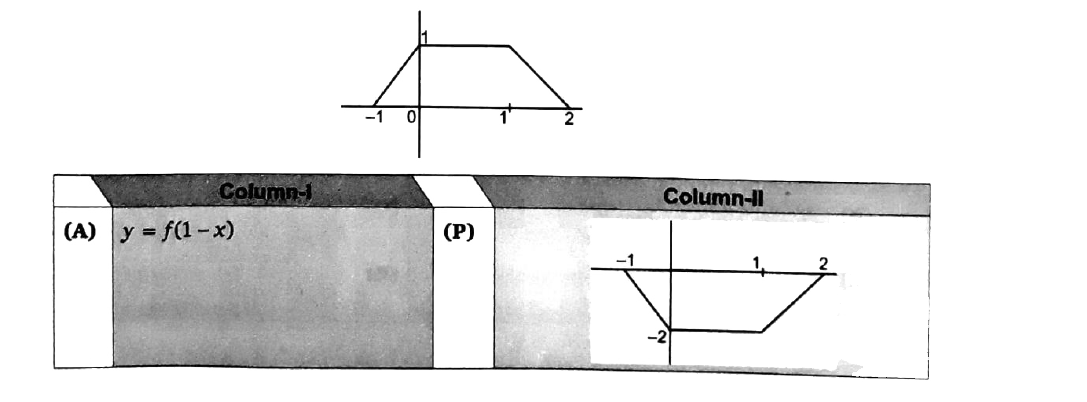
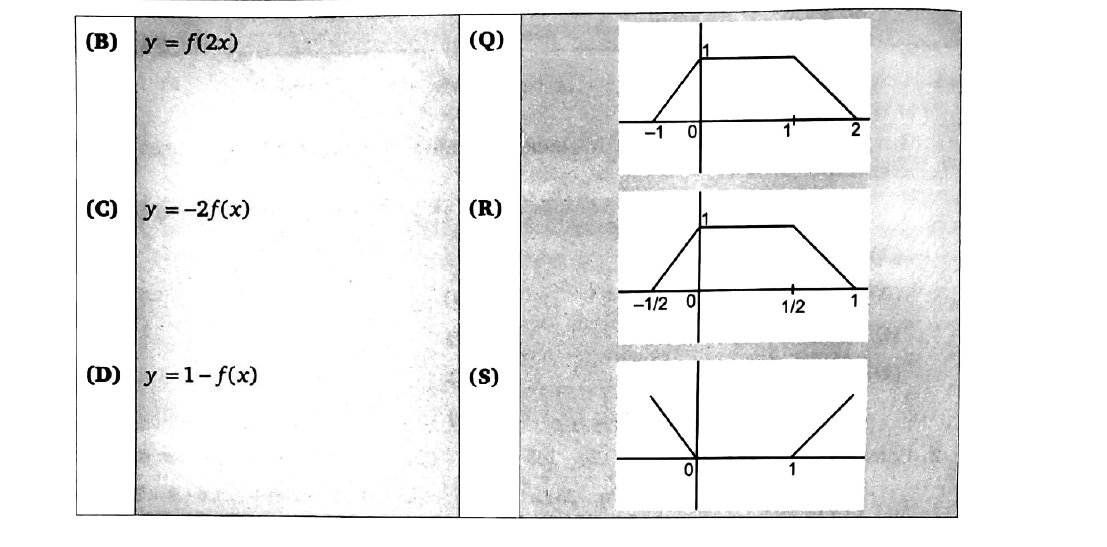
View SolutionIm6. The graph of function f(x) is as shown, adjacently. Then the graph of 1(|x|) is
View SolutionIf the graph of y=|f(x)| is as shown in figure
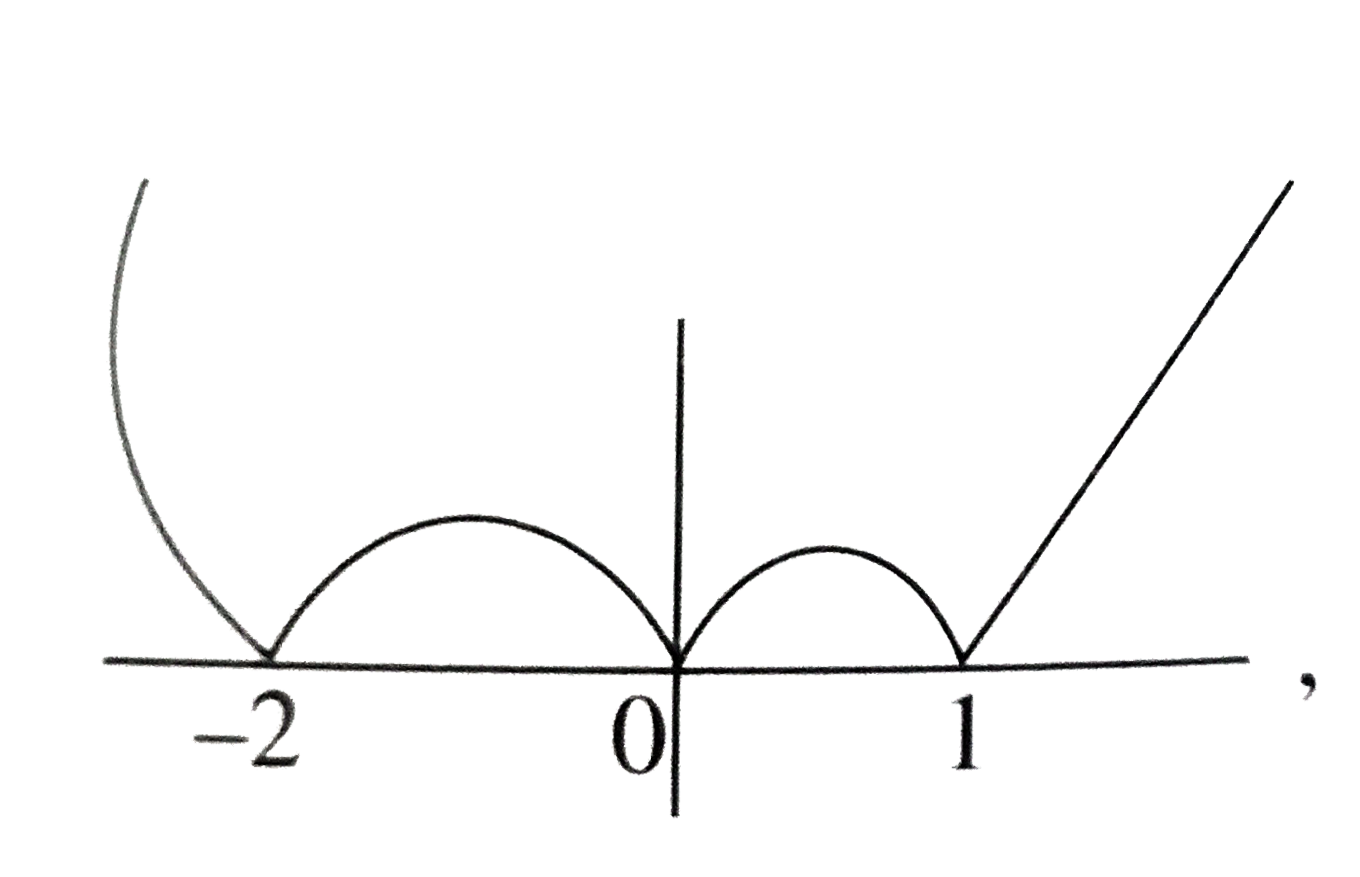 then the graph of y=f(x) may be
View SolutionLet graph of y=f(x) is
View SolutionLet graph of y=f(x) is
View Solution
