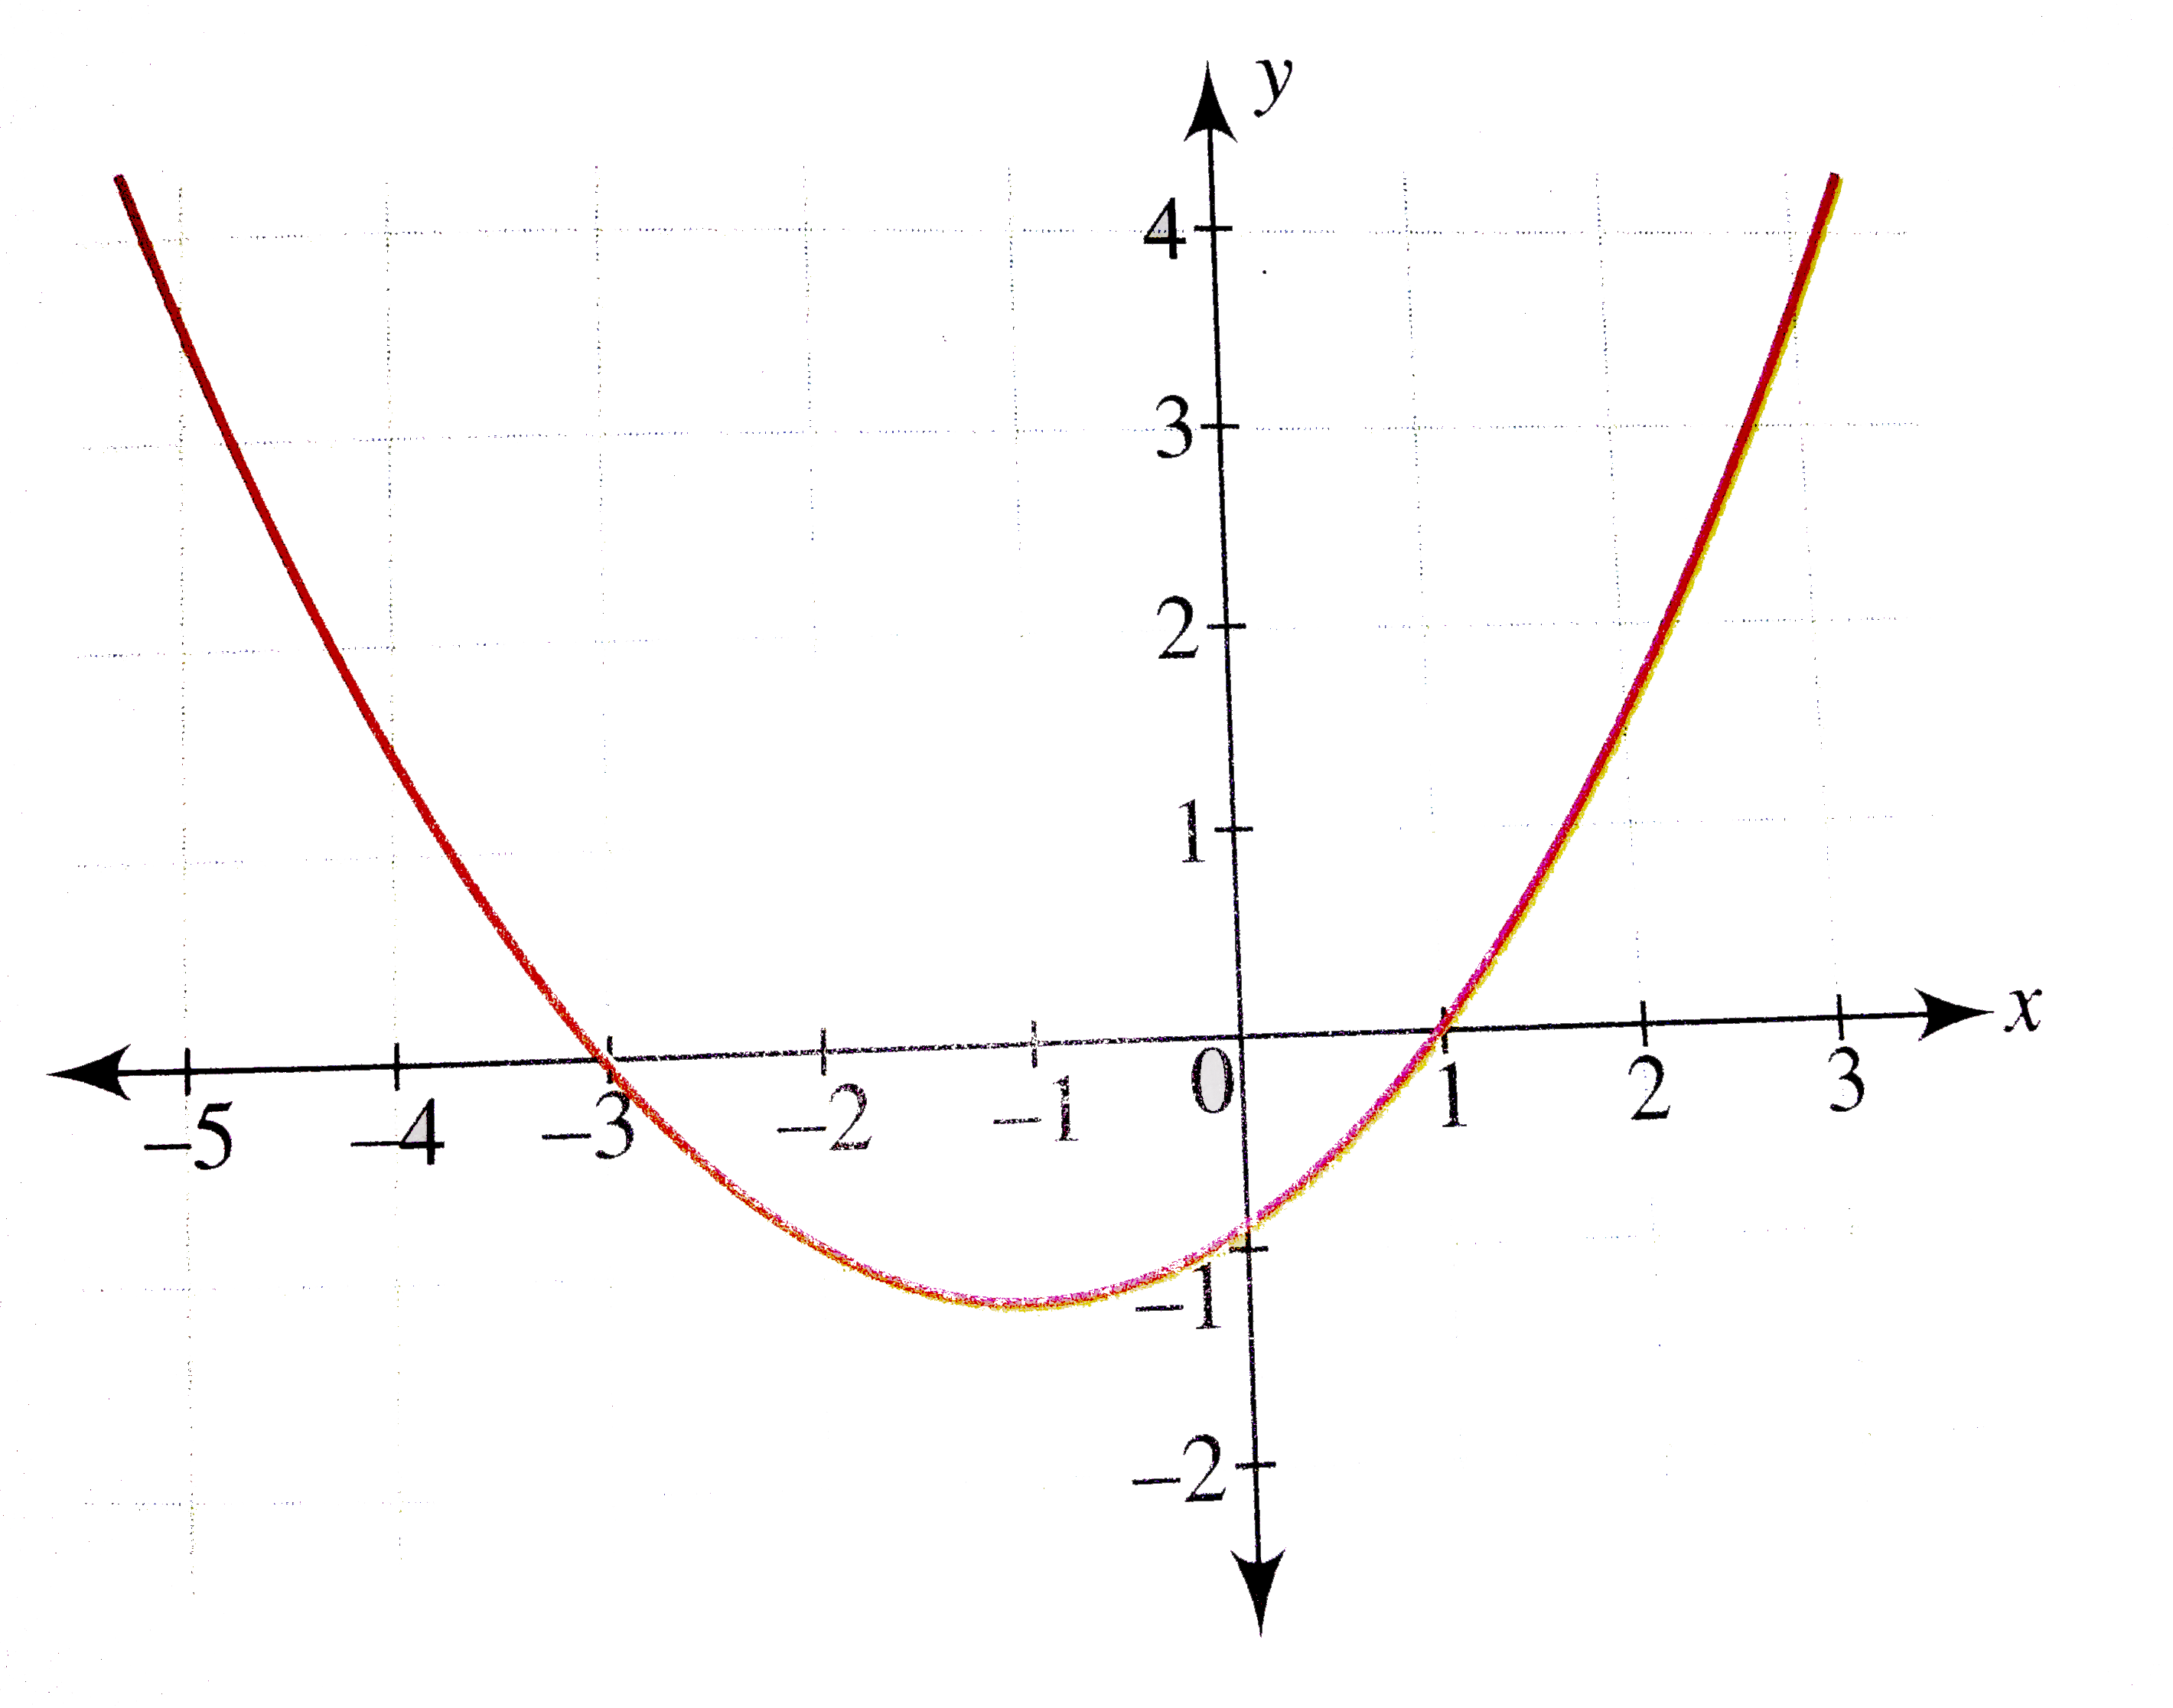
Given the graph of the function y=f(x), draw the graph of y=sgn(x).

Video Solution
Text Solution
From the graph, f(x)>0 for x<−3orx>1
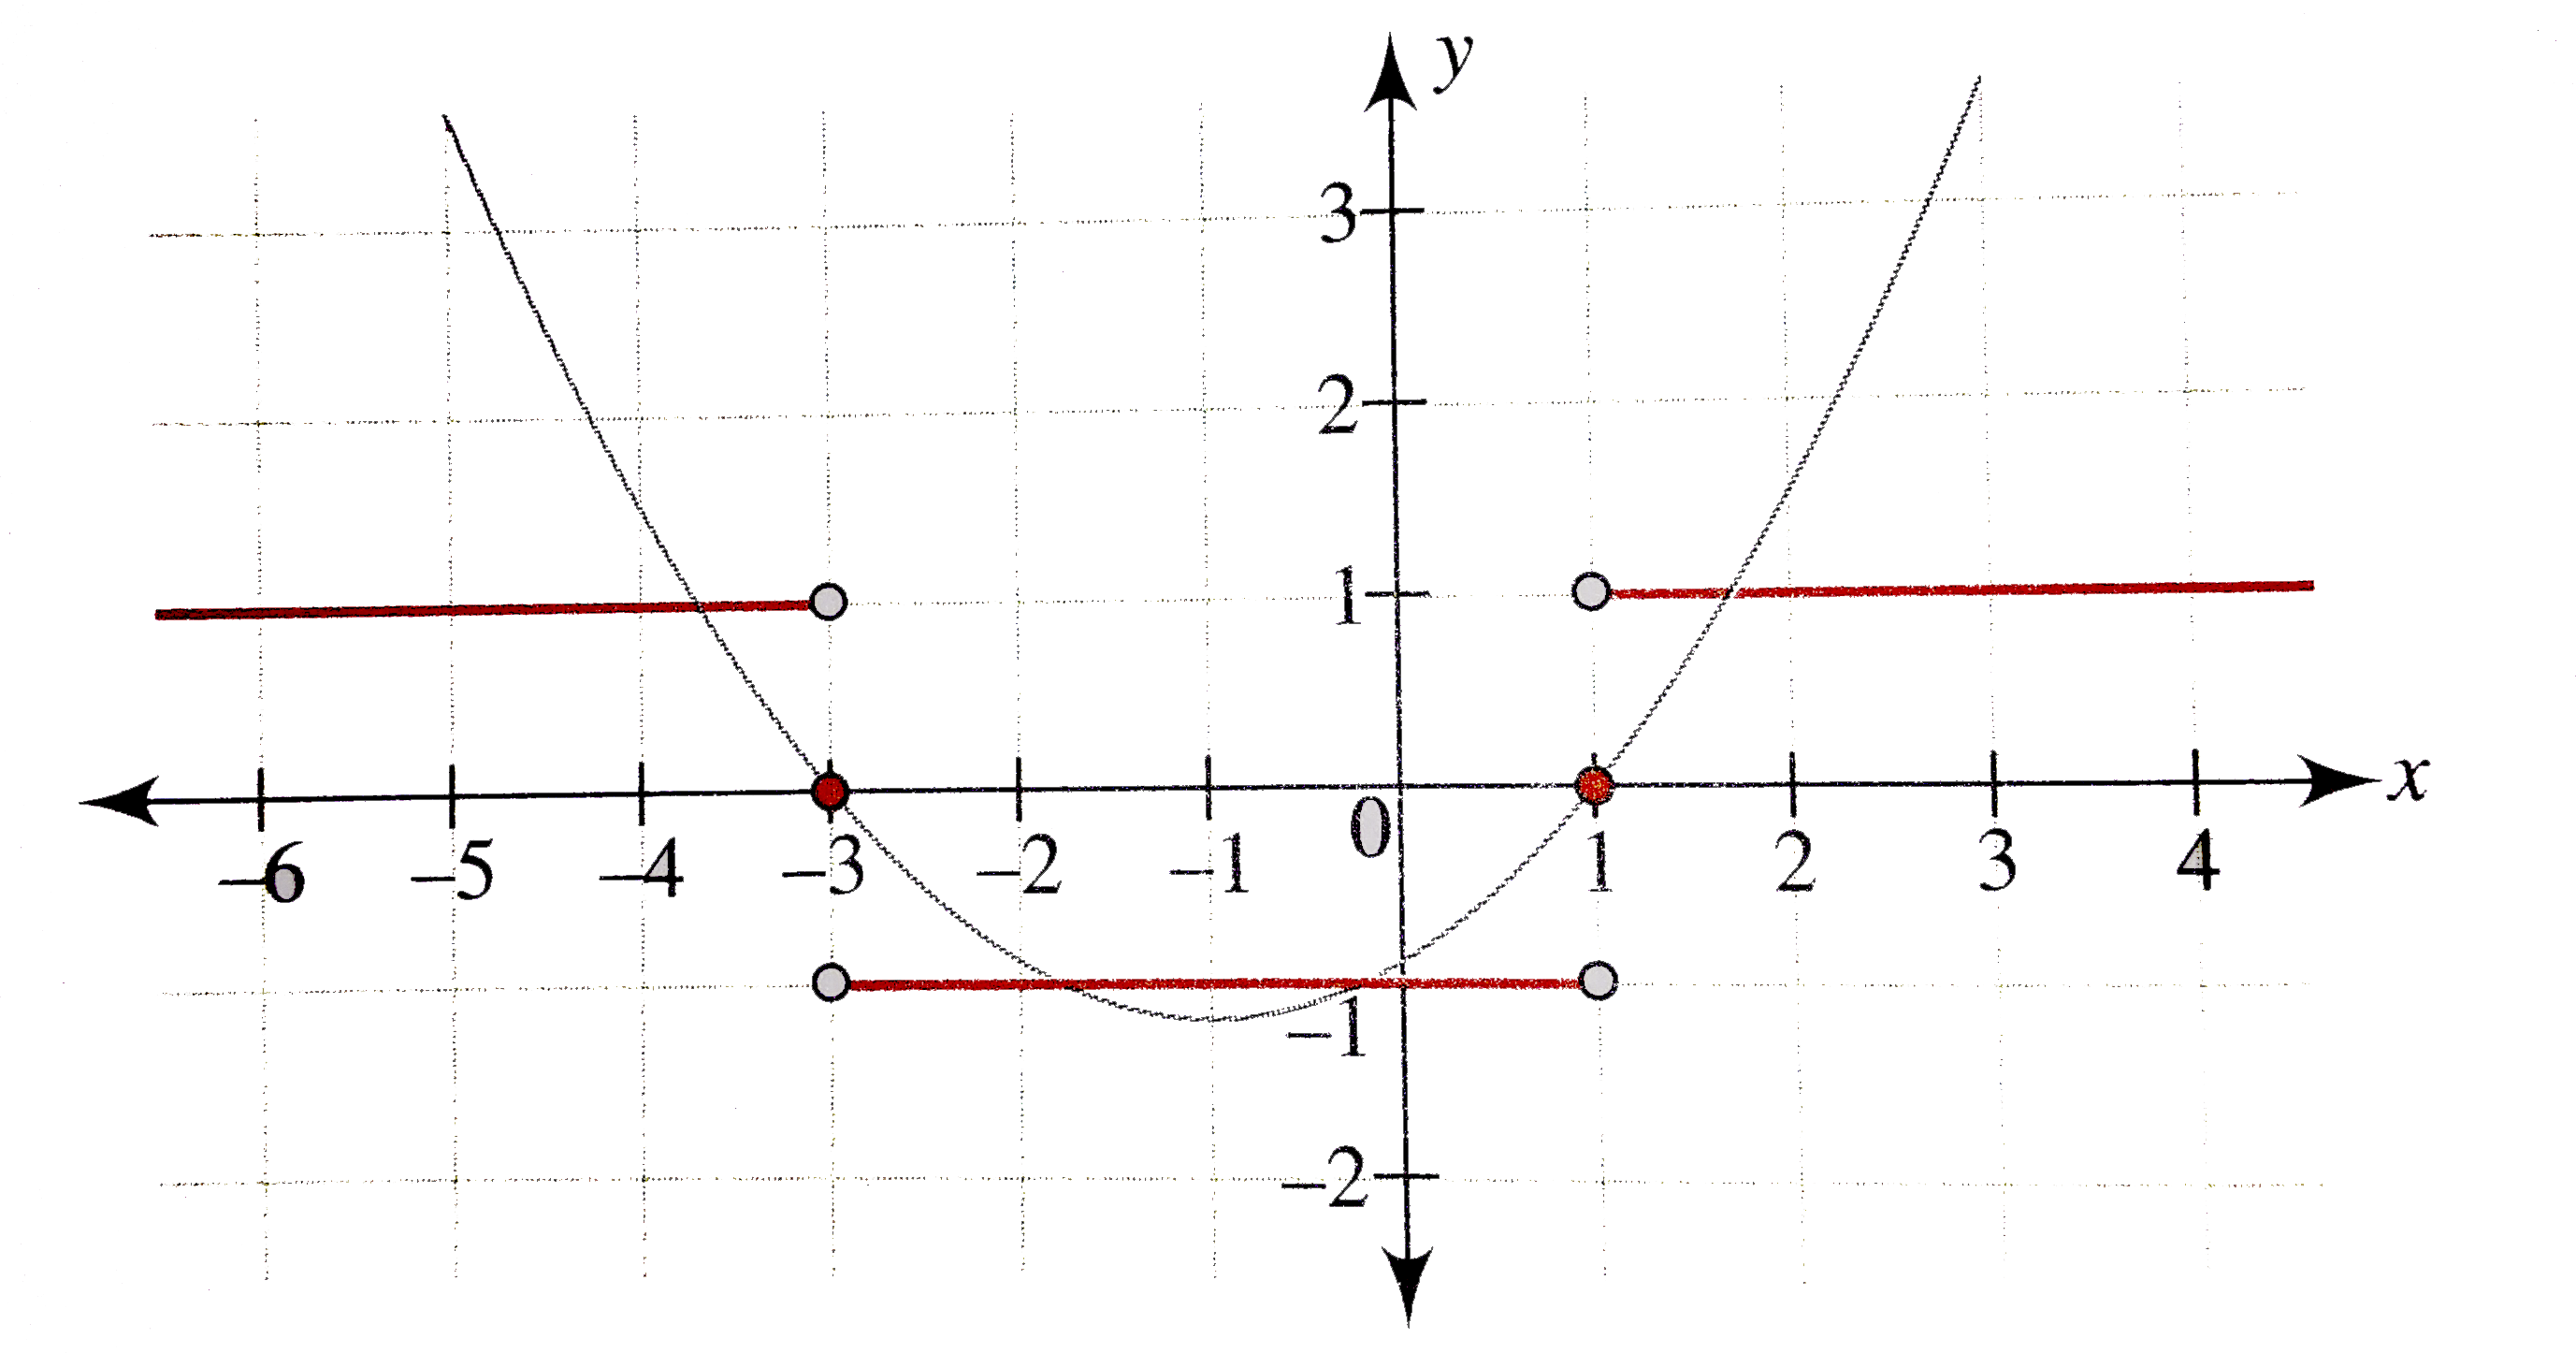
∴ sgn(f(x))=1 for x∈(−∞,−3)∪(1,∞)
f(x)<0 for x∈(−3,1)
∴ sgn(f(x))=−1 for x∈(−3,1)
f(x)=0 for x=−3,1
∴ sgn(f(x))=0 for x=−3,1
Hence the graph of y=sgn(f(x)) is as shown in the following figure.

|
Topper's Solved these Questions
- GRAPHS OF ELEMENTARY FUNCTIONS BOOK - CENGAGECHAPTER - GRAPHS OF ELEMENTARY FUNCTIONS EXERCISE - Exercise
34 Videos
- GRAPHS OF POLYNOMIAL AND RATIONAL FUNCTIONSBOOK - CENGAGECHAPTER - GRAPHS OF POLYNOMIAL AND RATIONAL FUNCTIONSEXERCISE - Exercise
13 Videos
- GRAPHS OF TRIGONOMETRIC FUNCTIONSBOOK - CENGAGECHAPTER - GRAPHS OF TRIGONOMETRIC FUNCTIONSEXERCISE - Exercise
22 Videos
Similar Questions
Draw the graph of y=|x|
View SolutionDraw the graph of y=−x
View SolutionDraw the graph of y=2x.
View SolutionDraw the graph of y=x−sinx
View SolutionDraw the graph of y≤x+2.
View SolutionDraw the graph of y=sin|x|.
View SolutionGiven the graph of y=f(x)


View SolutionDraw the graph : x+y=4
View SolutionDraw the graph of the function f(x)=xx
View SolutionDraw the graph of y=|x|+2
View Solution
