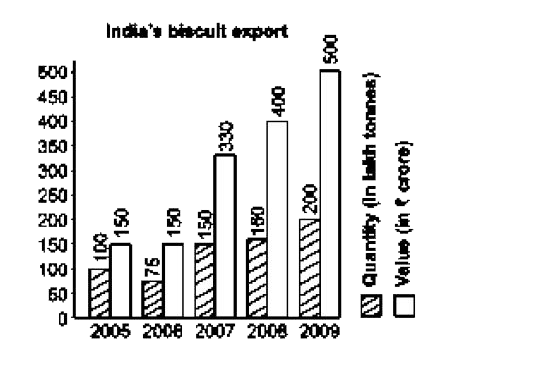
What was the percentage drop in export quantity from 2005 to 2006?
0.75
0
0.25
0.5
The correct Answer is:C
Step by step video, text & image solution for What was the percentage drop in export quantity from 2005 to 2006? by Maths experts to help you in doubts & scoring excellent marks in Class 14 exams.
Topper's Solved these Questions
- BOOK - ARIHANT SSCCHAPTER - BAR CHARTEXERCISE - Higher Skill Level Questions20videos
BAR CHART
- BOOK - ARIHANT SSCCHAPTER - BAR CHARTEXERCISE - Higher Skill Level Questions20videos
BAR CHART
- BOOK - ARIHANT SSCCHAPTER - AVERAGESEXERCISE - Final Round27videos
AVERAGES
- BOOK - ARIHANT SSCCHAPTER - BOATS AND STREAMS EXERCISE - EXERCISE HIGHER SKILL LEVEL QUESTIONS9videos
BOATS AND STREAMS
Similar Questions
The given bar graph shows the biscuit exports of India over a period of five years. Study the graph and answer the question that follows.
दिया गया दंड आरेख में पांच साल की अवधि में भारत के बिस्किट निर्यात को दर्शाता है। आरेख का अध्ययन करें और उस प्रश्न का उत्तर दें जो पूछा गया है। What was the percentage drop in the export quantity from 2005 to 2006?
2005 से 2006 तक निर्यात की मात्रा में कितने प्रतिशत की गिरावट थी?View SolutionWhat was the percentage increase in export from 2006 to 2007? 1623% (b) 19% (c) 20% (d) 3313%
View Solution
Knowledge Check
- Question 1 - Select One
Study the following graph carefully and answer the following questions -----
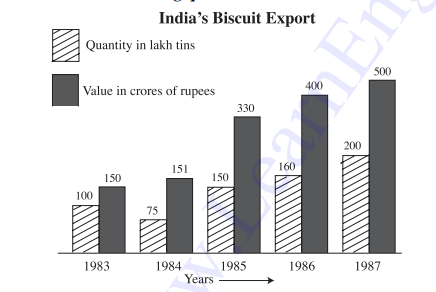
What was the percentage drop in export quantity from 1983 to 1984 ?A75BNilC25D50 - Question 2 - Select One
Following is a data regarding export and import of a company over the years. Answer the question given below.
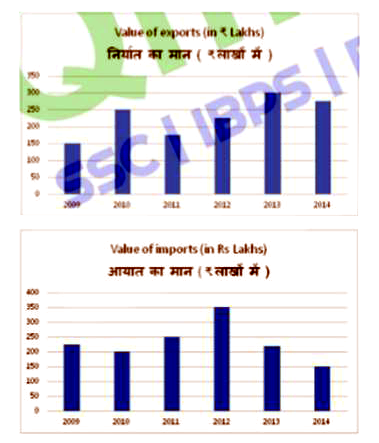
What was the percentage decline in the value of exports from 2010 to 2011?A30%B17%C25%D3% - Question 3 - Select One
Production of steel in different companies in three consecutive years (in lakh tonnes)
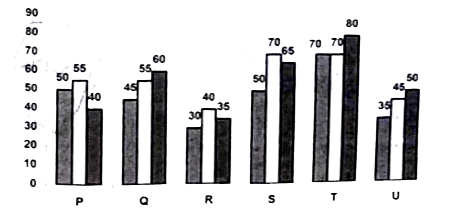
What is the percentage decline in production by company R from 2005 to 2006?AA) 5%BB) 20%CC) 15%DD) 12.5%
What is the percent increase in export of company C from 2004 to 2008 ?
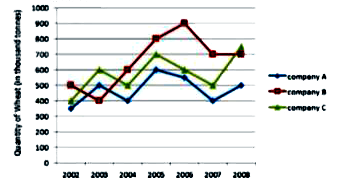 View Solution
The bar chart given below shows the export (in lacs) from india from year 2008 to 2015.
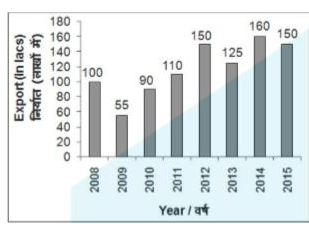
What is the percentage change in the exports from year 2012 to year 2013?View SolutionStudy the following graph carefully to answer the questions that follows
Production of Alluminium by different companies in three consecutive years (in lakh tonne)
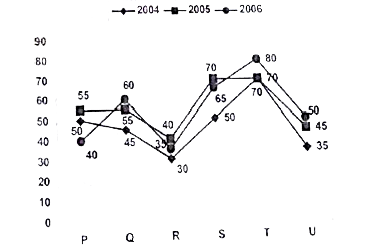
What is the percentage decline in production of company R from 2005 to 2006?View SolutionStudy the following graph carefully and answer the questions given below it -----
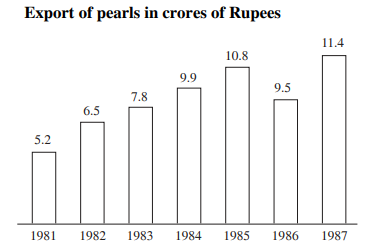
What was the percentage increase in export from 1986 to 1987 ?View SolutionStudy the following graph carefully and answer the question given below-----
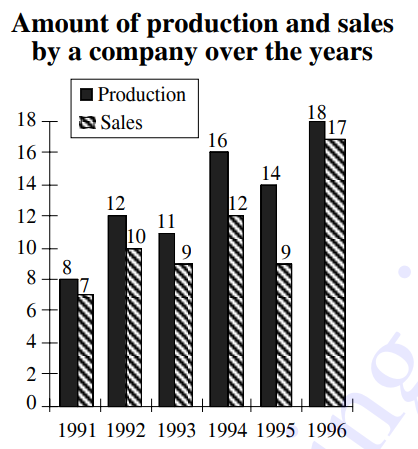
What was the percentage drop in sales from 1992 to 1993 ?View Solution

