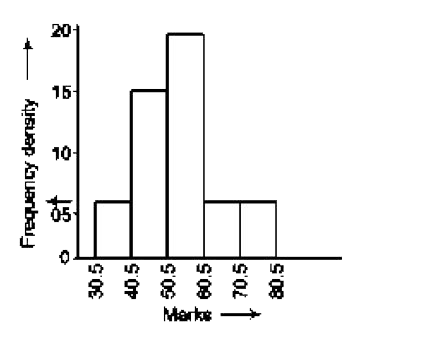
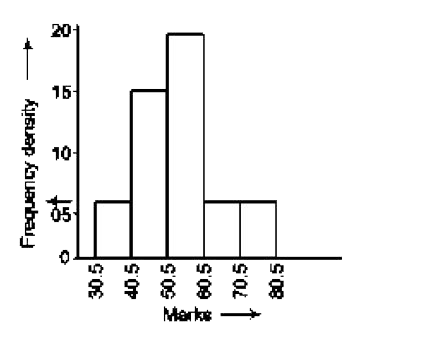
The following histogram shows the distribution of marks of 50 students in a college.The percentage of the students, whose marks lie between 40.5 and 60.5 is
60
70
75
None of these
Step by step video, text & image solution for The following histogram shows the distribution of marks of 50 students in a college.The percentage of the students, whose marks lie between 40.5 and 60.5 is by Maths experts to help you in doubts & scoring excellent marks in Class 14 exams.
Topper's Solved these Questions
- BOOK - ARIHANT SSCCHAPTER - BAR CHARTEXERCISE - Higher Skill Level Questions20videos
BAR CHART
- BOOK - ARIHANT SSCCHAPTER - BAR CHARTEXERCISE - Higher Skill Level Questions20videos
BAR CHART
- BOOK - ARIHANT SSCCHAPTER - AVERAGESEXERCISE - Final Round27videos
AVERAGES
- BOOK - ARIHANT SSCCHAPTER - BOATS AND STREAMS EXERCISE - EXERCISE HIGHER SKILL LEVEL QUESTIONS9videos
BOATS AND STREAMS
Similar Questions
Knowledge Check
- Question 1 - Select One
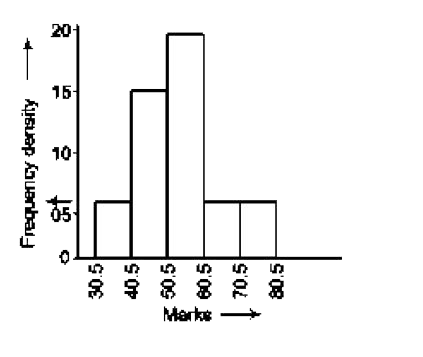
The following histogram shows the distribution of marks of 50 students in a collegeThe average marks of the students, number is
 A43.5B44.5C45.5D74.7
 - Question 2 - Select One
The number of student, whose marks lie between 40.5 and 50.5 is
 A15B10C5DNone of these
 - Question 3 - Select One
Study the histogram of marks (in Mathematics) distribution of 50 students of class IX and answer the following questions.
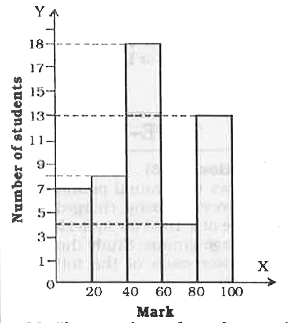
The percentage of students who have secured marks more than 59 is :A13B17C34D26
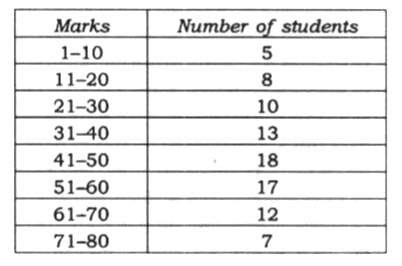
The following table shows frequency distribution of marks secured by 100 students in a particular examination. Find the mean of the marks.
 View Solution
The distribution given below show the marks of 100 students of a class:
then find Ogive medium of data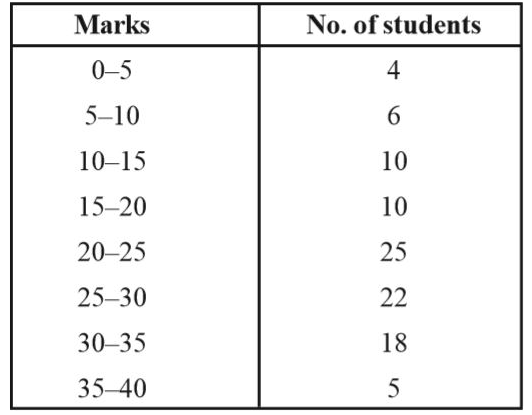 View Solution
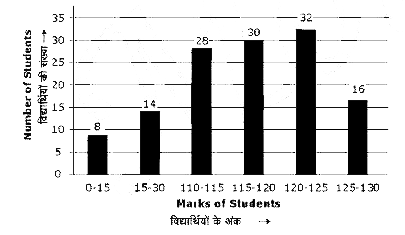
In each of the following questions, the following histogram shows the relationship between the marks obtained by the students and the number of students in an examination. Study the histogram and answer the questions.
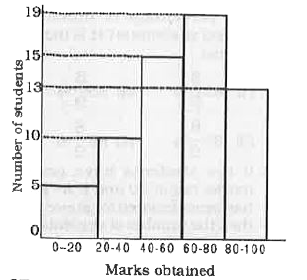
The percentage of students who obtained 40 markks or less isView SolutionIn each of the following questions, the following histogram shows the relationship between the marks obtained by the students and the number of students in an examination. Study the histogram and answer the questions.
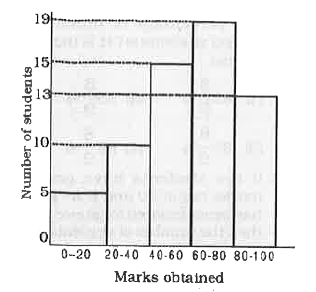
The ratio of the number of students who obtained 60 or more marks to that of students who obtained 60 or less marks isView SolutionStudy the histogram of marks (in Mathematics) distribution of 50 students of class IX and answer the following questions.
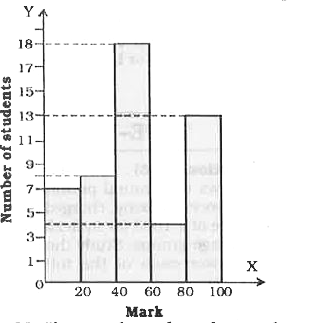
The number of students who have scored between 39 and 80 is :View Solution


