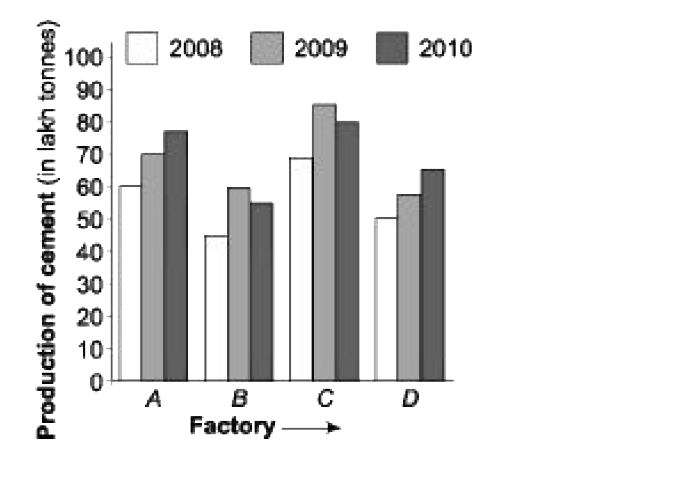
Which of the given factories has recorded the maximum percentage growth in production of cement from 2009 to 2010?

D
A
B
C
The correct Answer is:A
Step by step video, text & image solution for Which of the given factories has recorded the maximum percentage growth in production of cement from 2009 to 2010? by Maths experts to help you in doubts & scoring excellent marks in Class 14 exams.
Topper's Solved these Questions
Similar Questions
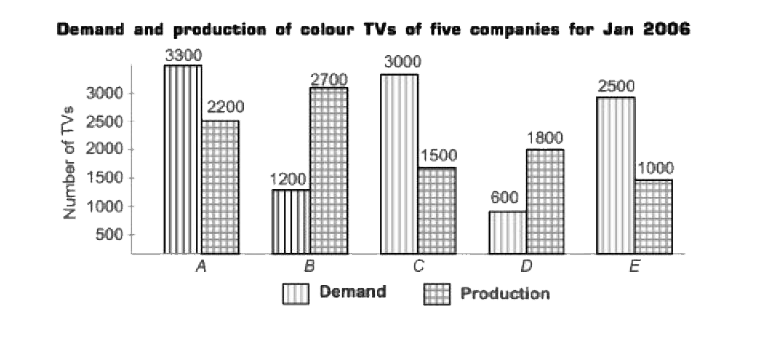
What is the ratio of the number of companies having more demand than production to the number of companies having more production than demand?
 06:07View Solution
There are 3 sets of natural numbers 1 ot 100. Set A contains all the natural numbers which are prime, upto 100. Set B contains all the non-prime even natural numbers upto 100. Set C contains all the non-prime odd natural numbers upto 100 i.e.,
A = {2,3,5,7,11,...89, 97}
B = {4,6,8,10,12,...98,100}
C = {1,9,15,21,25,27,33,95,99}
The average of the elements of the Set A and C combined as :02:11View SolutionA boat running upstream takes 528 min to cover a certain distance, while it takes 240 min to cover the same distance running down stream.What is the ratio between the speed of the boat and speed of the water current, respectively?
01:31View SolutionWhich of the following are correct chain isomers of butane ? (i)
02:45View SolutionDetermine the point of symmetry of a regular hexagon.
02:17View SolutionDtermine the images of the following figure about the given line :
05:41View SolutionMatch the following Column A to Column B
 02:21View Solution
Match the following Column A to Column B
 02:21View Solution
Match the following Column A to Column B
 02:03View Solution
Find the area of the figure given below.
 02:10View Solution
Calculate the volume of the given solid.
ltimg src="https://d10lpgp6xz60nq.cloudfront.net/physics_images/PS_MATH_VII_C06_E03_002_Q01.png" width="80%"gt02:17View SolutionThe area of the shaded part in the figure given below is ______.
 02:10View Solution
The inequation represented by the graph given below is :
04:23View SolutionThe inequation that best describes the graph given below is _________
06:00View SolutionThe inequation that best describes the following graph is _________
01:52View Solution

