For which model the percentage rise/ fall in production from 2012 to 2013 was minimum?
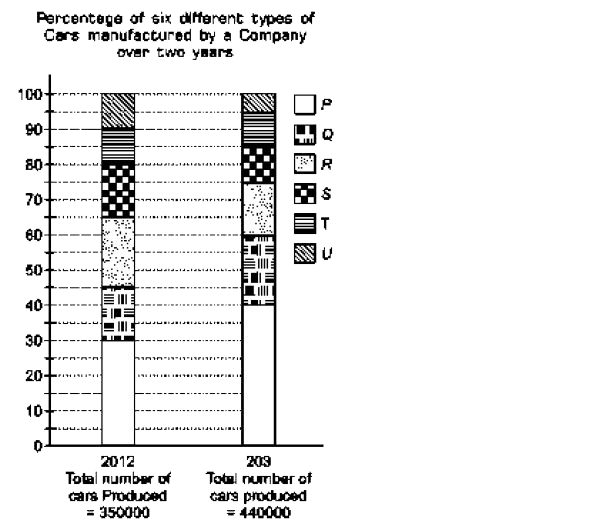
Q
R
S
T
Step by step video, text & image solution for For which model the percentage rise/ fall in production from 2012 to 2013 was minimum? by Maths experts to help you in doubts & scoring excellent marks in Class 14 exams.
Topper's Solved these Questions
Similar Questions
The bar chart given below shows the percentage distribution of the production of various models of a ,mobile manufacturing company in 2007 and 2008. The total production in 2007 was 35 lakh mobile phones and in 2008 the production was 44 lakh. Study the chart and answer the following questions.
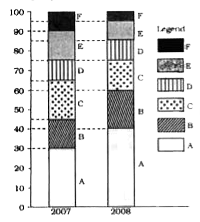
For which models was the percentage variation in production from 2007 to 2008 the maximum ?View SolutionFind the percentage increase in sales from 2012 to 2013
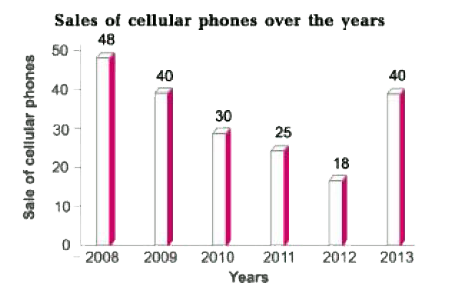 View Solution
Knowledge Check
- Question 1 - Select One
In which of the following years the percentage of rise or fall in production from the previous year is maximum for the flavour of Q ?
निम्न में से किस वर्ष में, पिछले वर्ष की तुलना में गन्ध Q के उत्पादन में वृद्धि या हास अधिकतम रहा है?
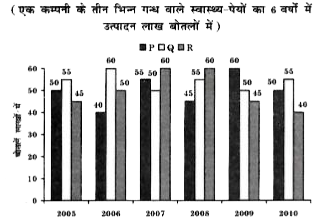 A2010B2006C2007D2009
 - Question 2 - Select One
Study the following graph carefully to answer the questions given below it Import and Export of spare parts by an automobile company over the given years
During which year the percentage rise/fall in exports from the previous year is the highest?A2001B2002C2004D2006 - Question 3 - Select One
Given here is a pie chart showing the cost of gold in 2010, 2011, 2012 and 2013. Study the chart and answer the following questions.
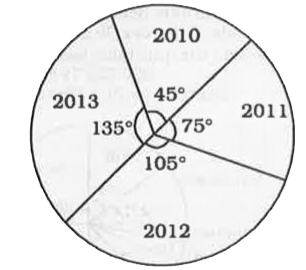
The rato of percentage increase in the price of gold from 2011 to 2012 and 2012 to 2013 isA6:5B7:5C8:5D9:5
For which of the following years, the percentage rise or fall in production from the previous year is the maximum for Company Y ? (a) 2007 (b) 2008 (c) 2009 (d) 2010 (e) 2007 and 2010
View SolutionProduction of three different flavours soft drinks X, Y and Z over a period of six years has been expressed in the following graph. Study the graph and answer the questions
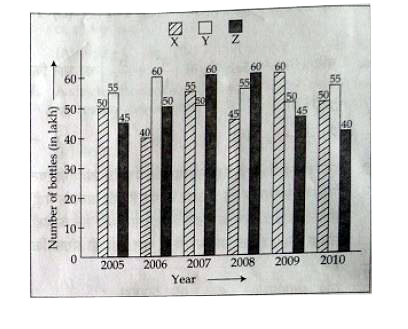
The percentage of rise/fall in production from the previous year is maximum for the flavour Y in this yearView SolutionThe bar graph given below shows the data of the production of paper (in lakh tonnes) by three different companies P, Q and R over the years.
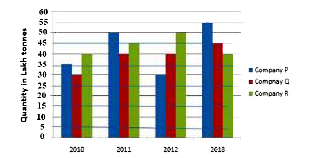
What is the percentage increase in the productionby company Q from 2010 to 2013?View SolutionThe percent rise in production in 2007 from 2006 is x %. Find the value of x
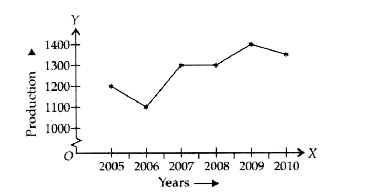 View Solution
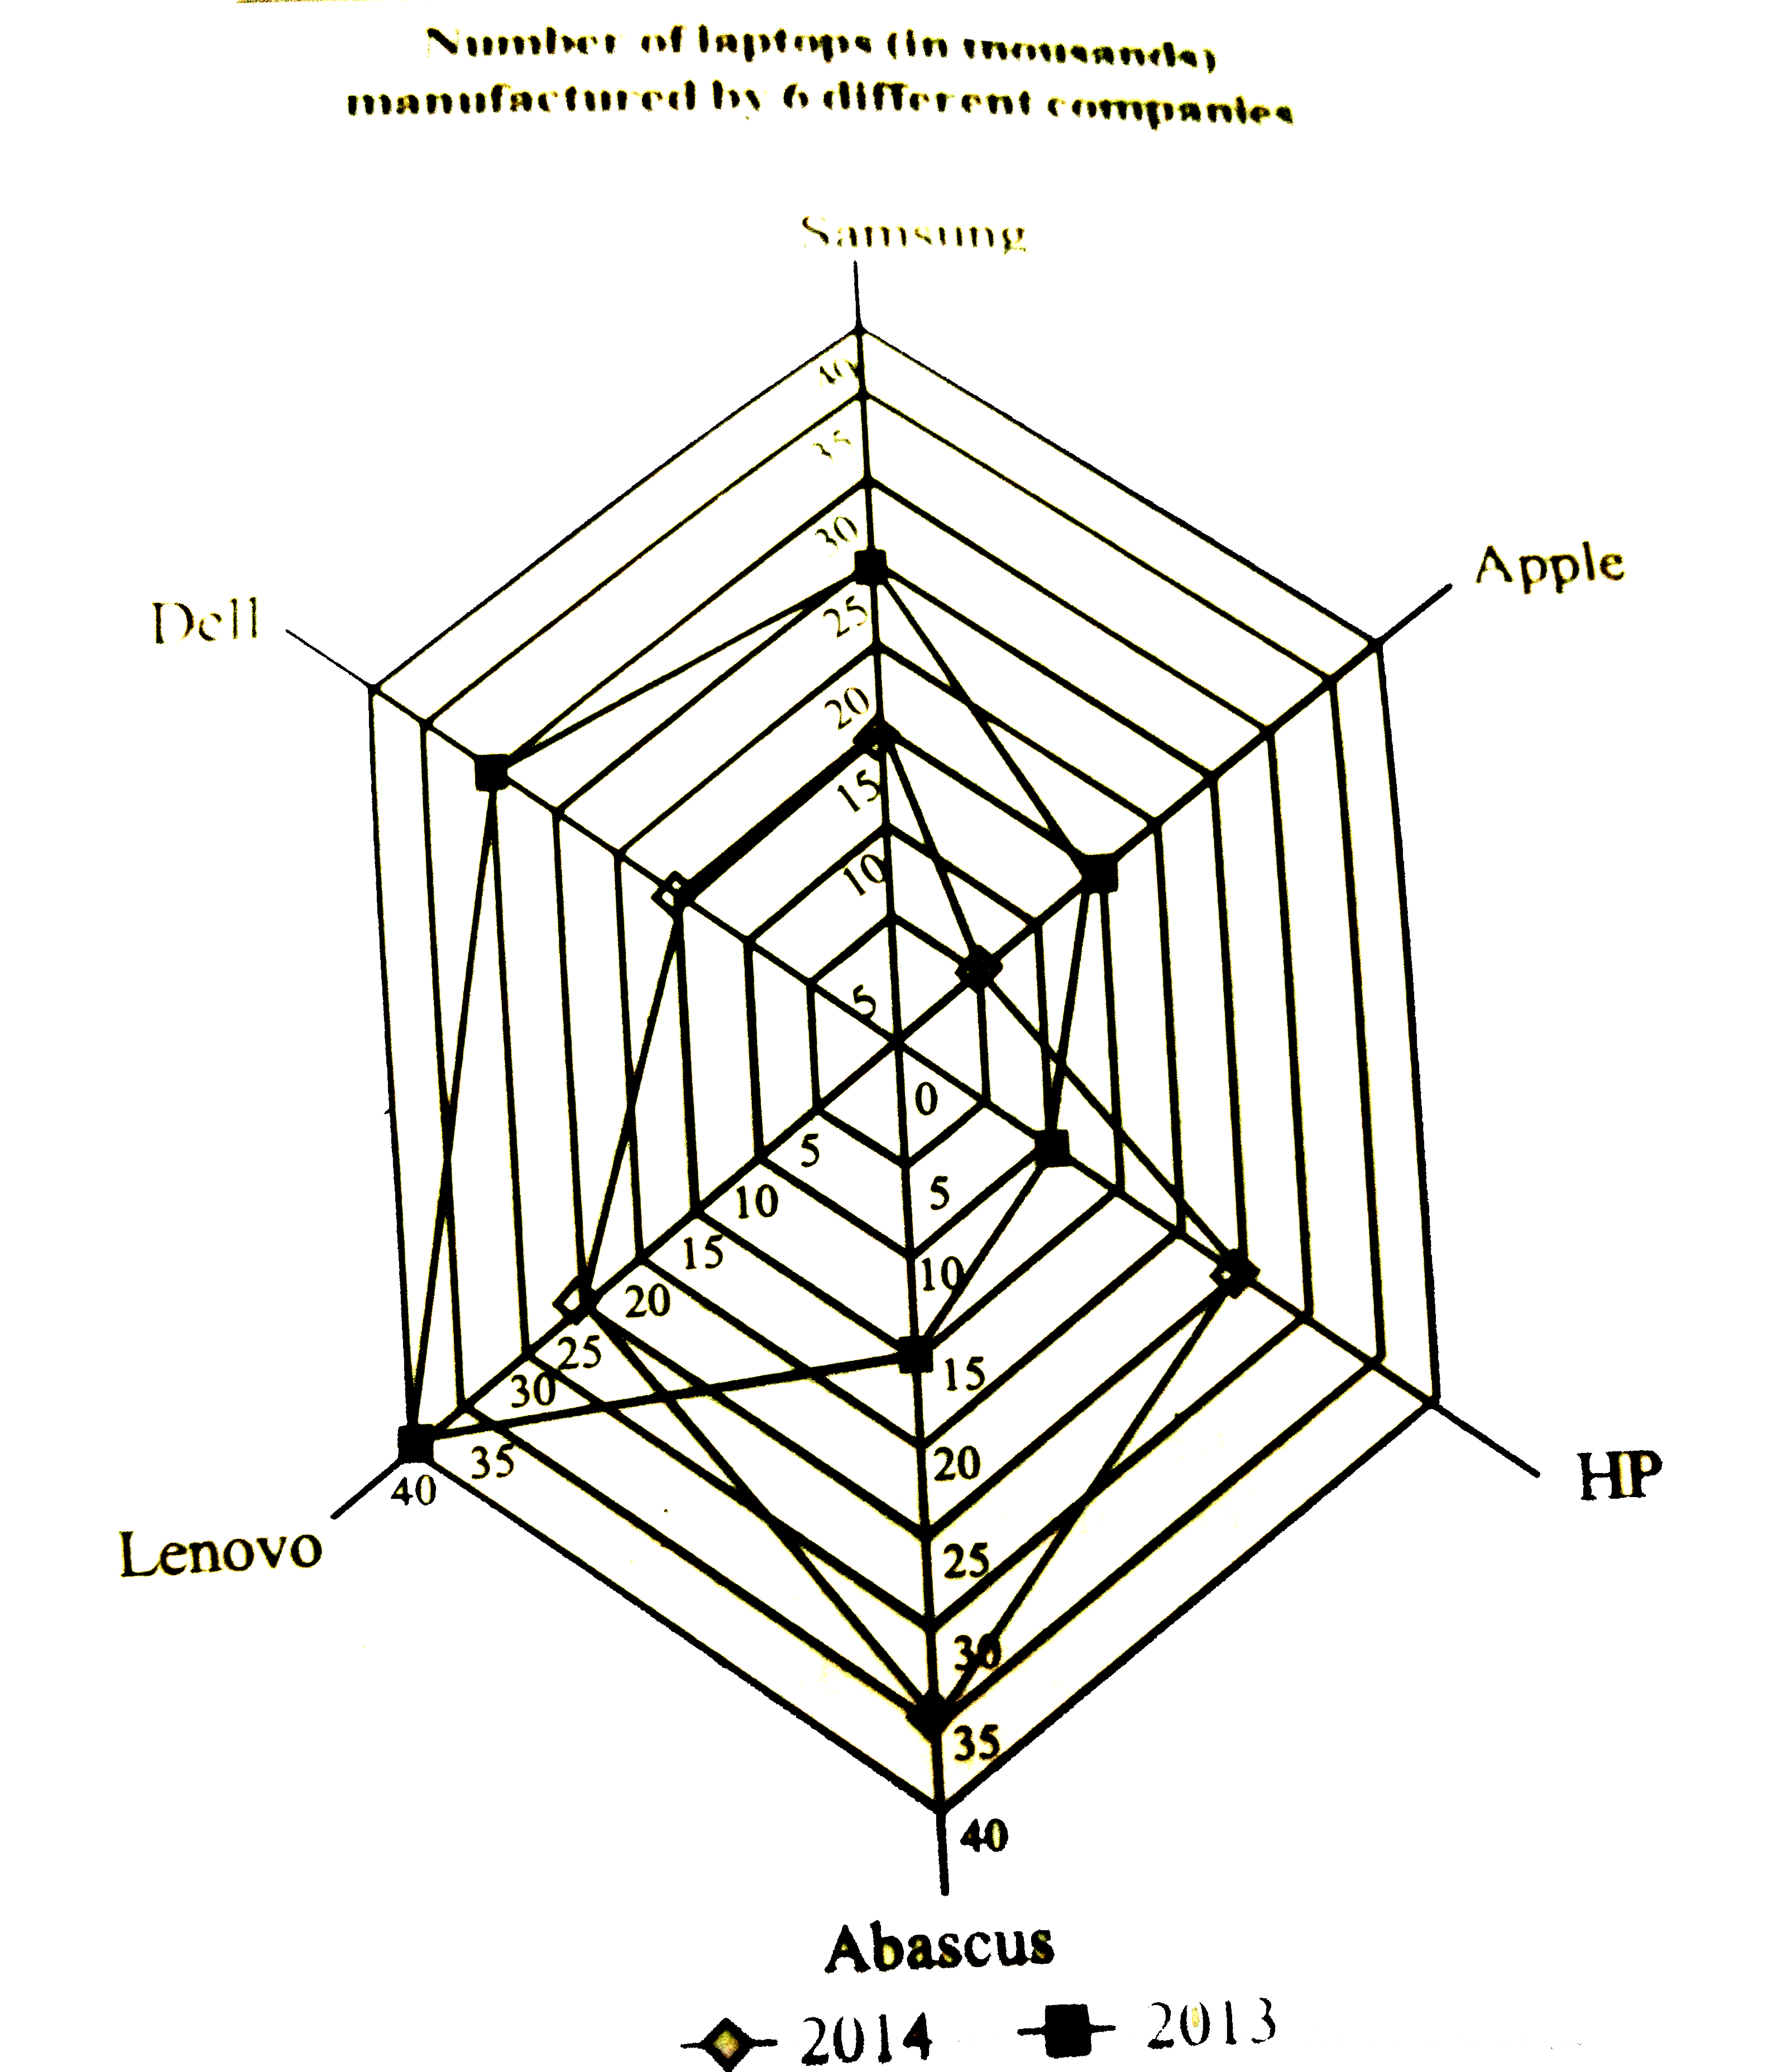
What is the percentage increases in production of laptops by HP in 2014 in comparison to that in 2013?View Solution

