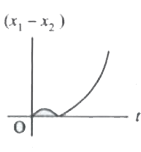
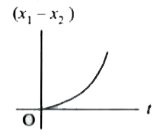
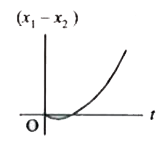
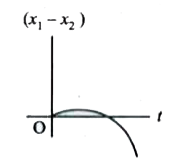
A body is at rest at x = 0. At t = 0, it starts moving in the positive x-direction with a constant acceleration. At the same instant another body passes through x = 0 moving in the positive x-direction with a constant speed. The position of the first body is given by X1 (r) after time t and that of the second body by x2 (r) after the same time interval. Which of the following graphs correctly describes (x1−x2 ) as a function of time t?


The correct Answer is:A
For 1st body, x1(t)=12at2
For second body, x2=v2t
∴x2=12at2−vt
When vt>12at2 then x1−x2 is -ve and when
12at2>vt then x1−x2 Is +ve.
Topper's Solved these Questions
- DESCRIPTION OF MOTION IN TWO AND THREE DIMENSIONBOOK - MODERN PUBLICATIONCHAPTER - DESCRIPTION OF MOTION IN TWO AND THREE DIMENSIONEXERCISE - MCQ(LEVEL-III)(Questions from AIEEE/ JEE Examinations)
6 Videos
- DESCRIPTION OF MOTION IN TWO AND THREE DIMENSIONBOOK - MODERN PUBLICATIONCHAPTER - DESCRIPTION OF MOTION IN TWO AND THREE DIMENSIONEXERCISE - RECENT COMPETITIVE QUESTIONS
7 Videos
- DESCRIPTION OF MOTION IN TWO AND THREE DIMENSIONBOOK - MODERN PUBLICATIONCHAPTER - DESCRIPTION OF MOTION IN TWO AND THREE DIMENSIONEXERCISE - Revision TEST
36 Videos
- DESCRIPTION OF MOTION IN ONE DIMENSION BOOK - MODERN PUBLICATIONCHAPTER - DESCRIPTION OF MOTION IN ONE DIMENSION EXERCISE - Revision Test
45 Videos
- E.M. INDUCTION AND A.C. CURRENTS BOOK - MODERN PUBLICATIONCHAPTER - E.M. INDUCTION AND A.C. CURRENTS EXERCISE - RECENT COMPETITIVE QUESTIONS
31 Videos
Similar Questions
A particle located at x = 0 at time t = 0, starts moving along the positive x-direction with a velocity that varies as v=p√x. The displacement of the particle varies with time as (where, p is constant)
View SolutionA body A moves with a uniform acceleration a and zero initial velocity. Another body B, starts from the same point moves in the same direction with a constant velocity v. The two bodies meet after a time t. The value of t is
View Solution
Knowledge Check
A particle located at x = 0 at time t = 0, starts moving along the positive x-direction with a velocity that varies as v=p√x. The displacement of the particle varies with time as (where, p is constant)
At3Bt2CtDt1/2
A particle located at position x=0, at time t=0, starts moving along the positive x-direction with a velocity v2=αx (where alpha is a positive constant). The displacement of particle is proportional to
View SolutionA particle located at position x=0, at time t=0, starts moving along the positive x-direction with a velocity v2=αx (where alpha is a positive constant). The displacement of particle is proportional to
View SolutionA particle located at "x=0" at time "t=0" starts moving along the positive "x" - direction with a velocity "v" that varies as "v=alpha sqrt(x)".The displacement "(x)" of the particle varies with time as "(alpha" is constant)
View SolutionA particle starts moving from position of rest under a constant acceleration. If it travels a distance x in t second, what distance will it travel in next t second?
View SolutionA particle starts moving from position of rest under a constant acceleration if it travels a distance x in t second, what distance will it travel in next t second?
View SolutionThe displacement to particle is zero at t=0andiszatt=t. It starts moving in the positive x-direction with a velocity which varies, v=k√x, wher (k) is a constant. Find the relation for variation of velocity with time.
View SolutionA body of mass m moving with a constant velocity v hits another body of the same mass moving with the same velocity v but in the opposite direction and sticks to it. The velocity of the compound body after collision is
View Solution
