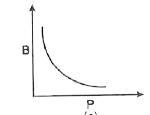
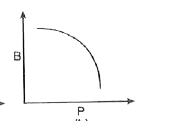
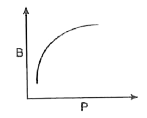
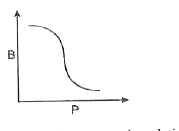
Which of the graphs shown in fig. correctly represents the variation of β=−(dv/dp)/V with P for an ideal gas at constant temperature:
A
B
C
D
Text Solution
The correct Answer is:A
Since PV=nRT
At constant temperature PV =constant
∴ Differentiating both side
Pdv+vdP=0
dVdP=−VP
⇒−(1VdVdP)=1P
or β=1P
Thus, β decrease as P increases
Hence, the correct choice is (a).
|
Topper's Solved these Questions
- HEAT AND THERMODYNAMICSBOOK - MODERN PUBLICATIONCHAPTER - HEAT AND THERMODYNAMICSEXERCISE - Multiple Choice Questions (Level - III) (Questions From AIEEE/JEE Examination)
17 Videos
- HEAT AND THERMODYNAMICSBOOK - MODERN PUBLICATIONCHAPTER - HEAT AND THERMODYNAMICSEXERCISE - Recent Competitve Questions
17 Videos
- HEAT AND THERMODYNAMICSBOOK - MODERN PUBLICATIONCHAPTER - HEAT AND THERMODYNAMICSEXERCISE - Recent Competitve Questions
17 Videos
- GRAVITATIONBOOK - MODERN PUBLICATIONCHAPTER - GRAVITATIONEXERCISE - Recent Competitive Questions
8 Videos
- LAWS OF MOTIONBOOK - MODERN PUBLICATIONCHAPTER - LAWS OF MOTIONEXERCISE - Revision test
43 Videos
Similar Questions
Knowledge Check
Which of the following graphs correctly represents the variation of β=−(dV/dP)/V with P for an ideal gas at constant temperature?
A B
B C
C D
D
Which of the following graphs correctly represents the variation of β=−dV/dPV
with P for an ideal gas at constant temperature?A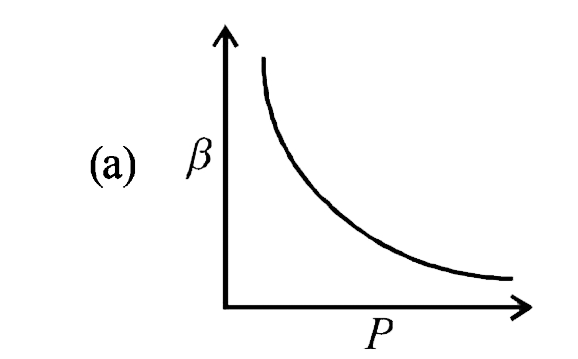 B
B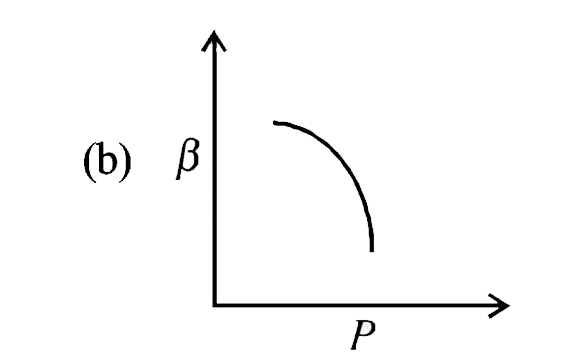 C
C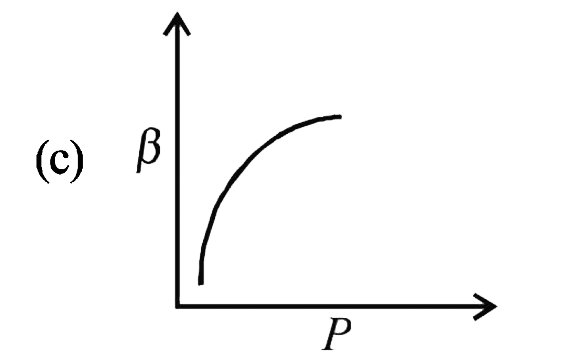 D
D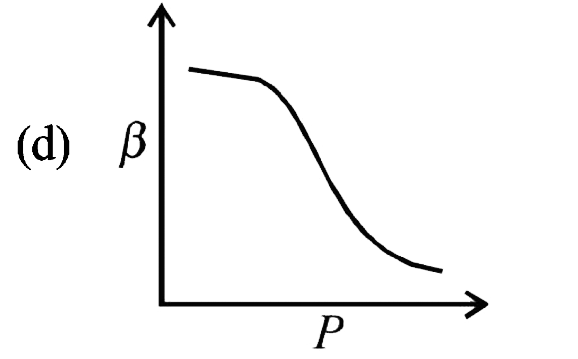
Which of the following graphs correctly represents the variation of β=−(dVdP)/V with P for an ideal gas at constant temperature
A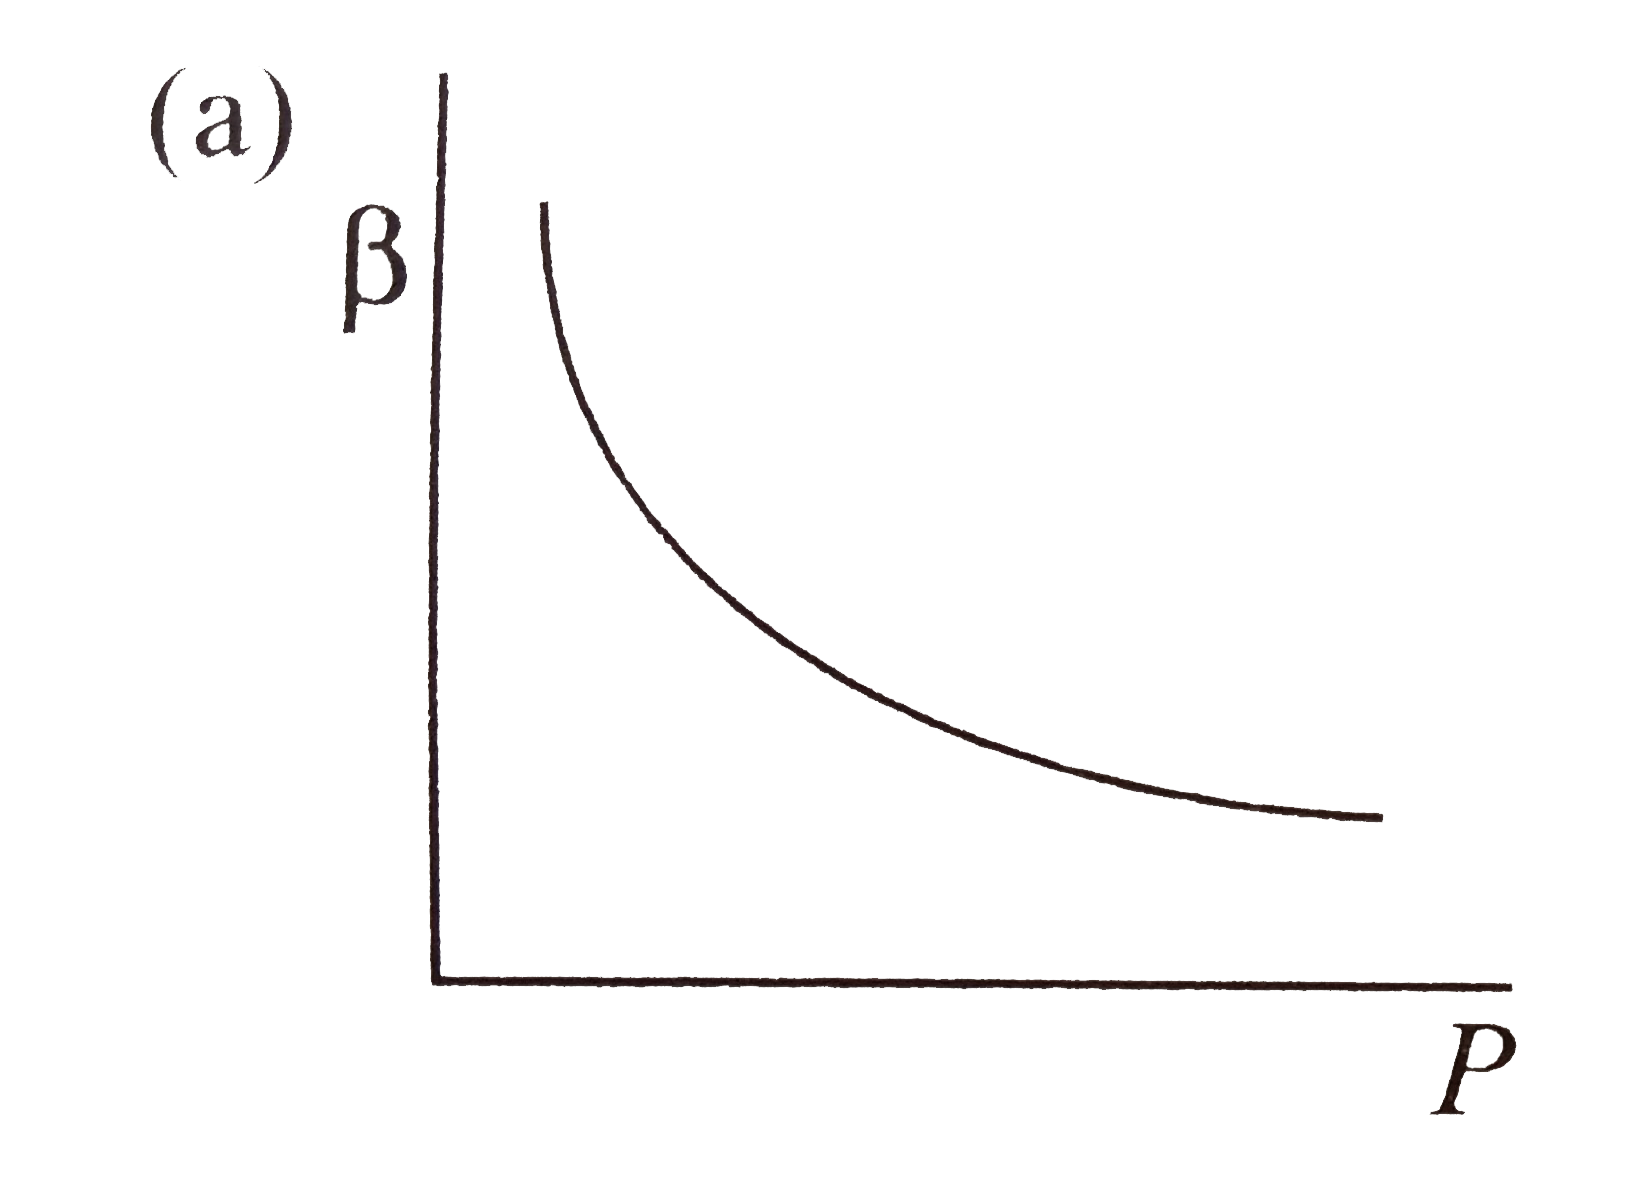 B
B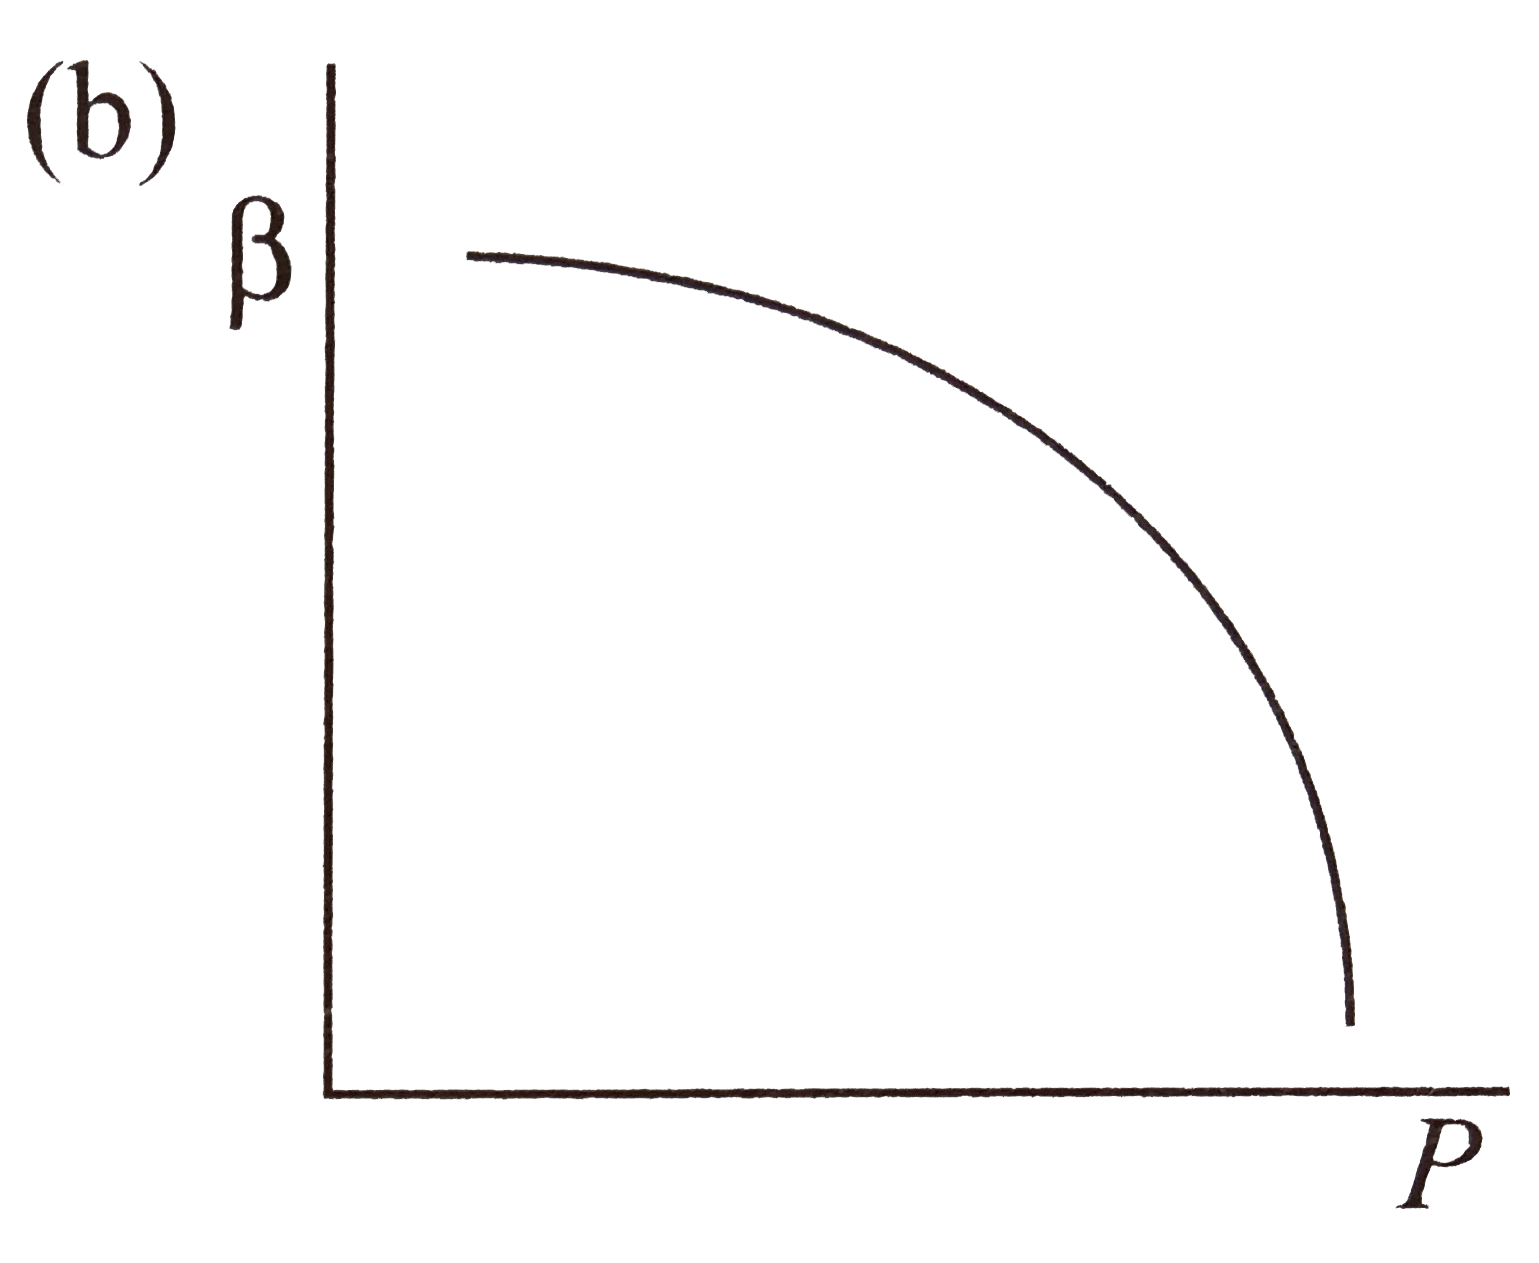 C
C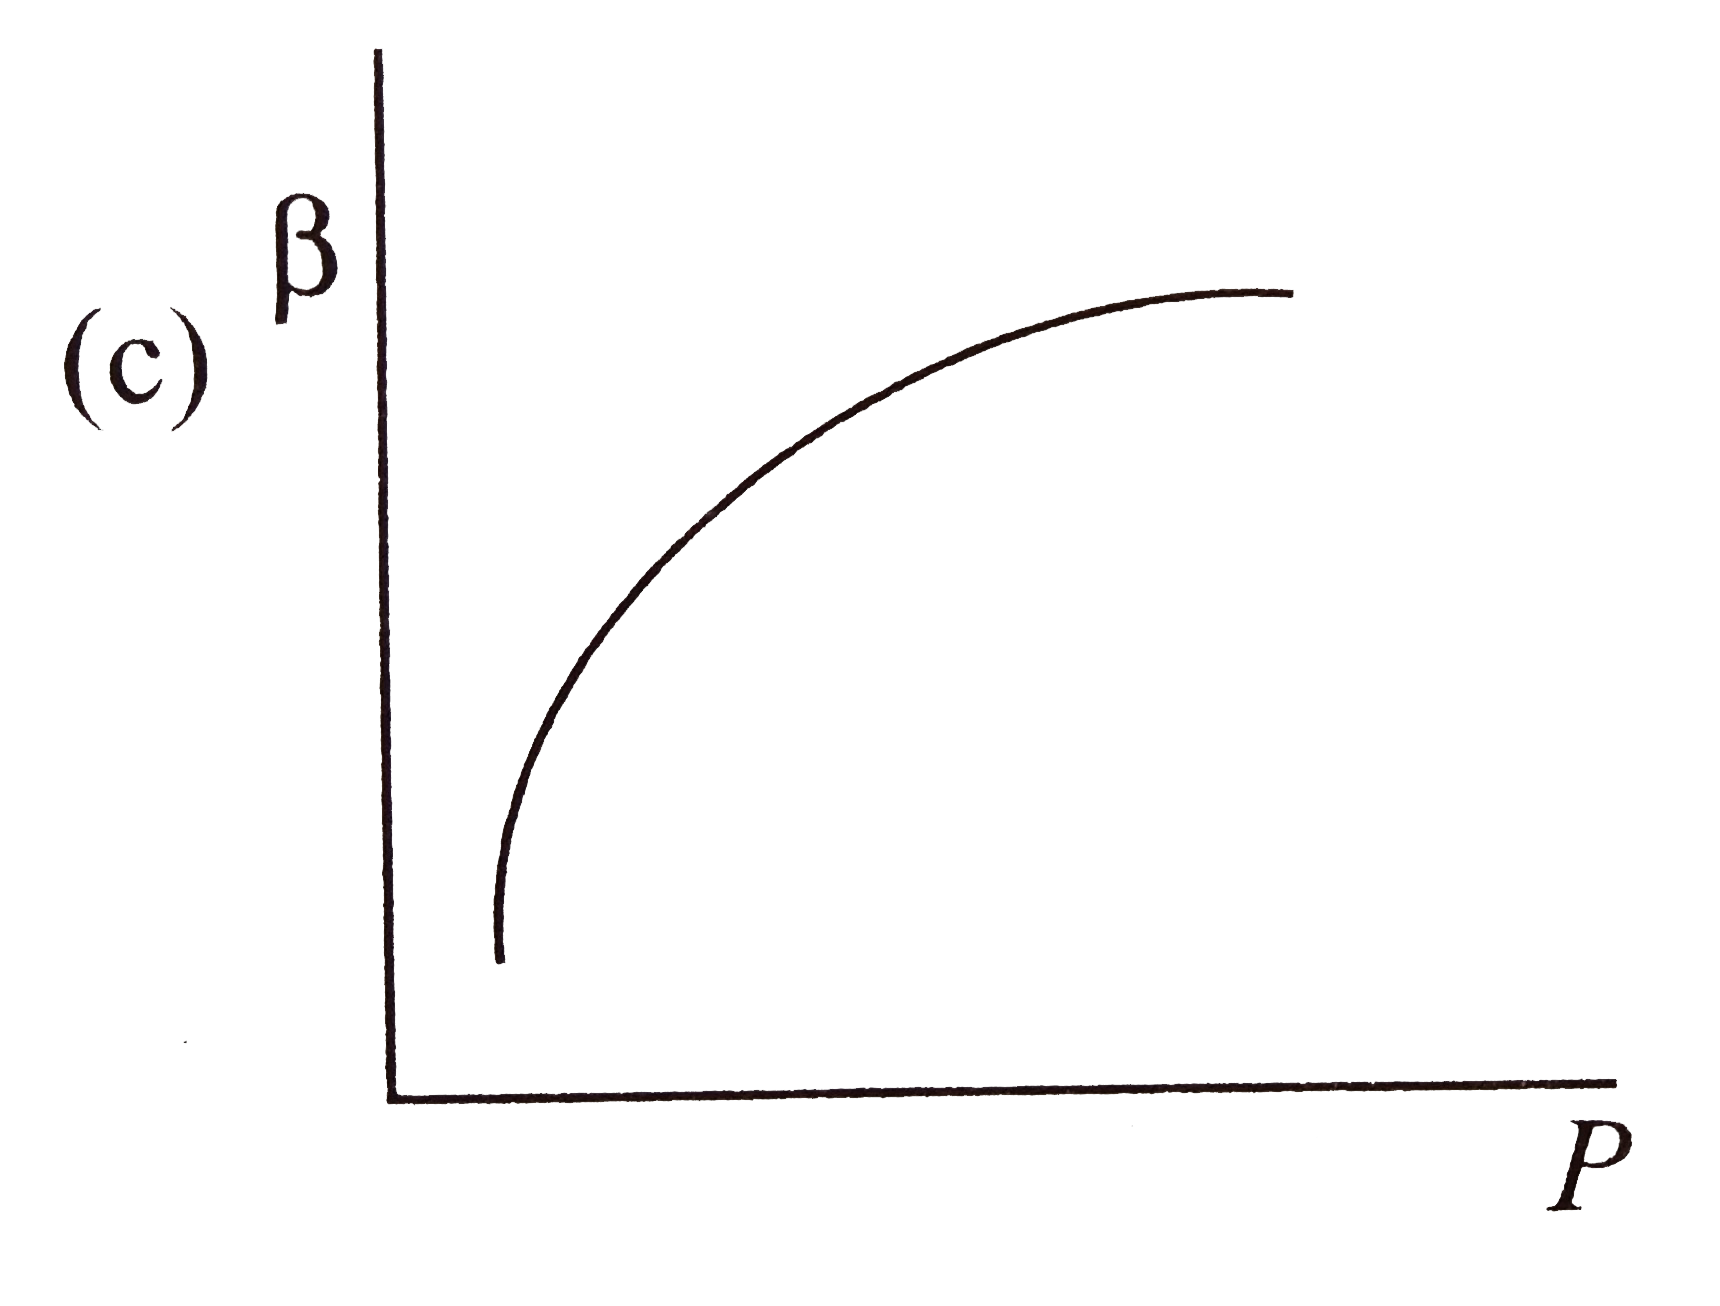 D
D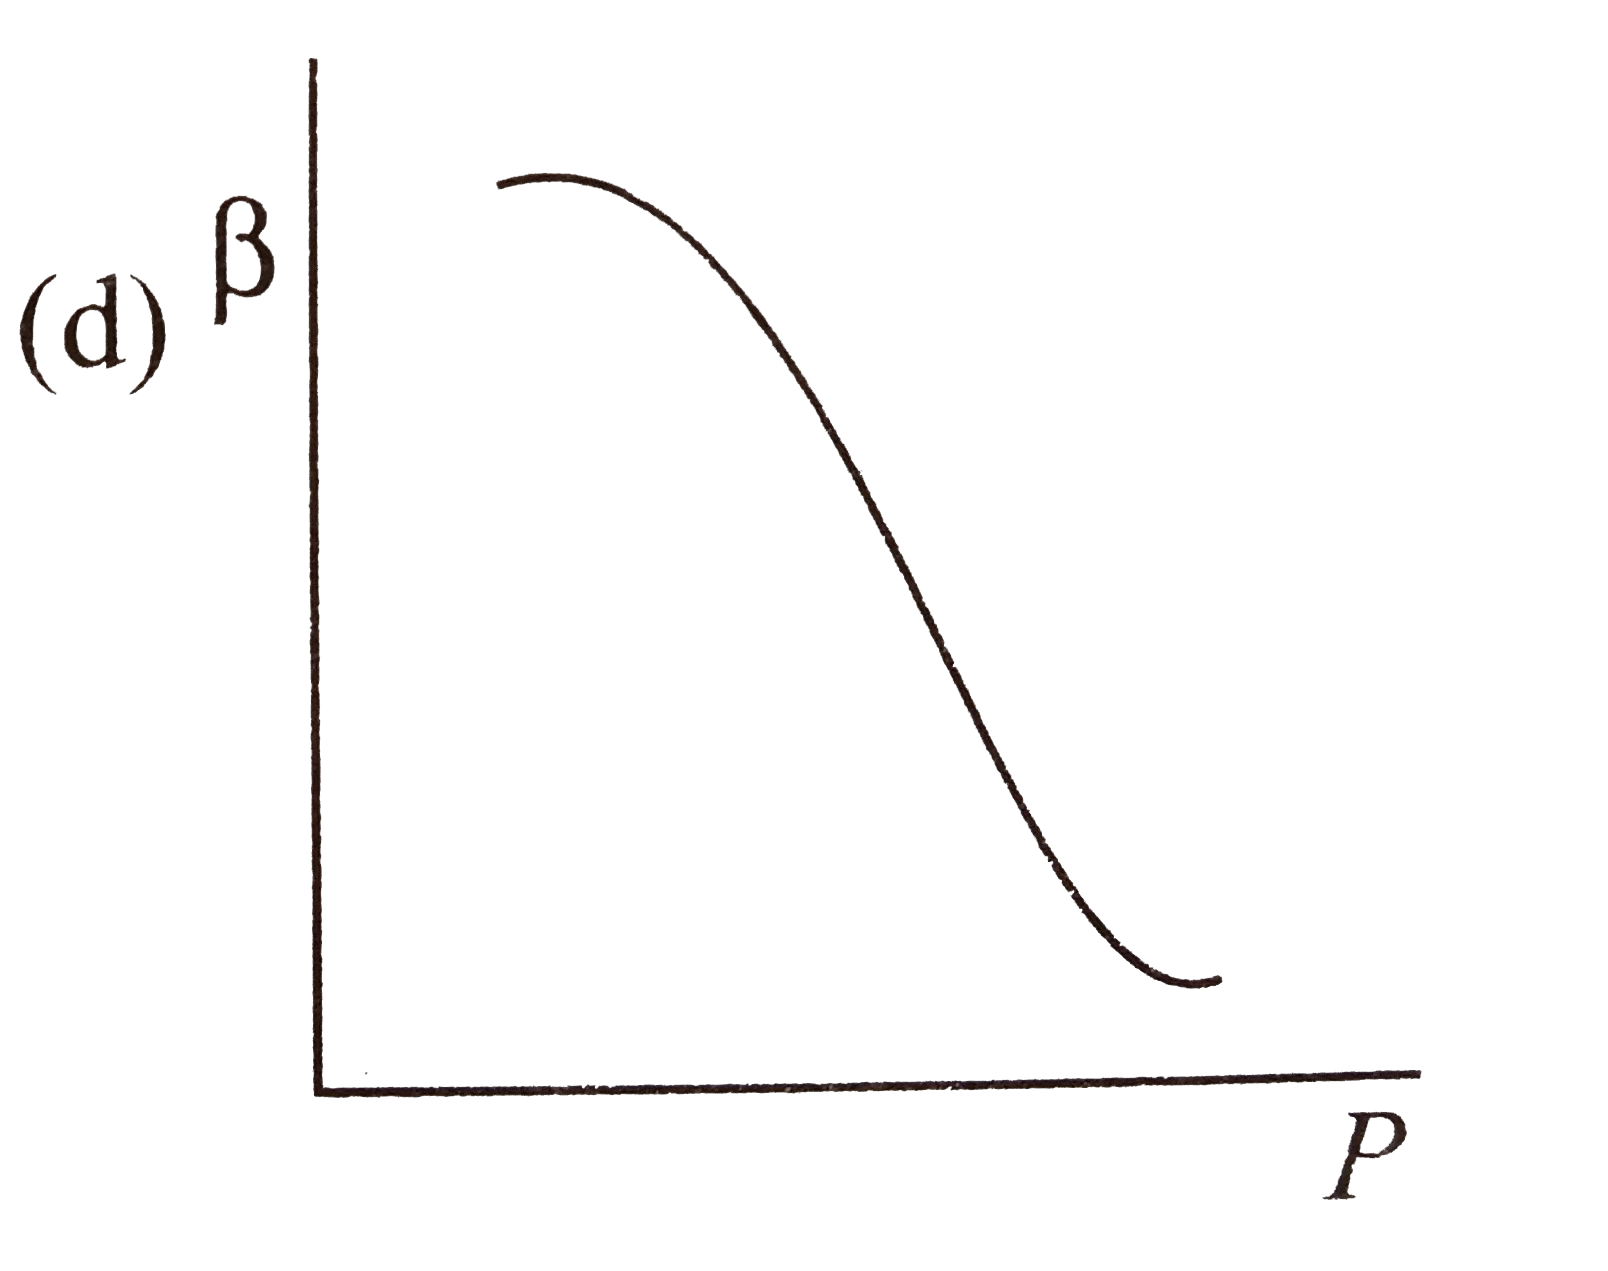
Which of the following graphs correctly represents the variation of β=−(dVdP)/V with P for an ideal gas at constant temperature
View SolutionWhich of the following graphs correctly represents the variation of β=−(dVdP)1V with P for an ideal gas at constant temperature ?
View SolutionWhich of the following graphs correctly represents the variation of β=−dV/dPV
with P for an ideal gas at constant temperature?
View Solutionwhich of the following graphs correctly represents the vatiation β=−(dVdP)T/V with P for an ideal gas at constant temperature ? .
View SolutionWhich of following graphs correctly represent variation of α=−(dV/dP)TV with P for fixed amount of an ideal gas at constant temperature ?
View Solution
