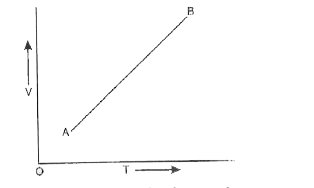
A volume V and temperature T was obtained, as shown in diagram, when a given mass of gas was heated. During the heating process the pressure is :
increased
decreased
remains constant
changed erratically.
The correct Answer is:B
Here on heating the volume increases mass remaining the same. The density decreases and since P∝ρ, the pressure decreases.
∴ Correct choice is (b).
Topper's Solved these Questions
- HEAT AND THERMODYNAMICSBOOK - MODERN PUBLICATIONCHAPTER - HEAT AND THERMODYNAMICSEXERCISE - Multiple Choice Questions (Level - III) (Questions From AIEEE/JEE Examination)
17 Videos
- HEAT AND THERMODYNAMICSBOOK - MODERN PUBLICATIONCHAPTER - HEAT AND THERMODYNAMICSEXERCISE - Recent Competitve Questions
17 Videos
- HEAT AND THERMODYNAMICSBOOK - MODERN PUBLICATIONCHAPTER - HEAT AND THERMODYNAMICSEXERCISE - Recent Competitve Questions
17 Videos
- GRAVITATIONBOOK - MODERN PUBLICATIONCHAPTER - GRAVITATIONEXERCISE - Recent Competitive Questions
8 Videos
- LAWS OF MOTIONBOOK - MODERN PUBLICATIONCHAPTER - LAWS OF MOTIONEXERCISE - Revision test
43 Videos
Similar Questions
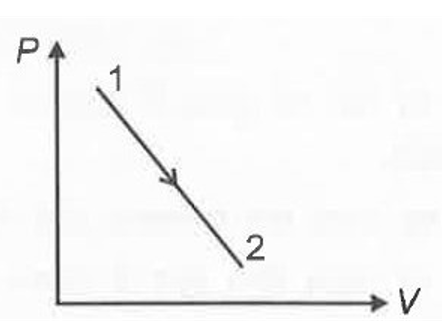
A volume V versus pressure P graph was obtained from state 1 to state 2 when a given mass of a gas is subjected to temperature changes. During the process the gas is
View SolutionThe pressure P of an ideal diatomic gas varies with its absolute temperature T as shown in figure . The molar heat capacity of gas during this process is [R is gas constant]

View Solution
Knowledge Check
A volume V absolute temperature T diagram was obtained when a given mass of gas was heated. During the heating process from state 1 to 2, the pressure
_E01_062_Q01.png) ARemain constantBDecreasedCChanged erraticallyDIncreased
ARemain constantBDecreasedCChanged erraticallyDIncreased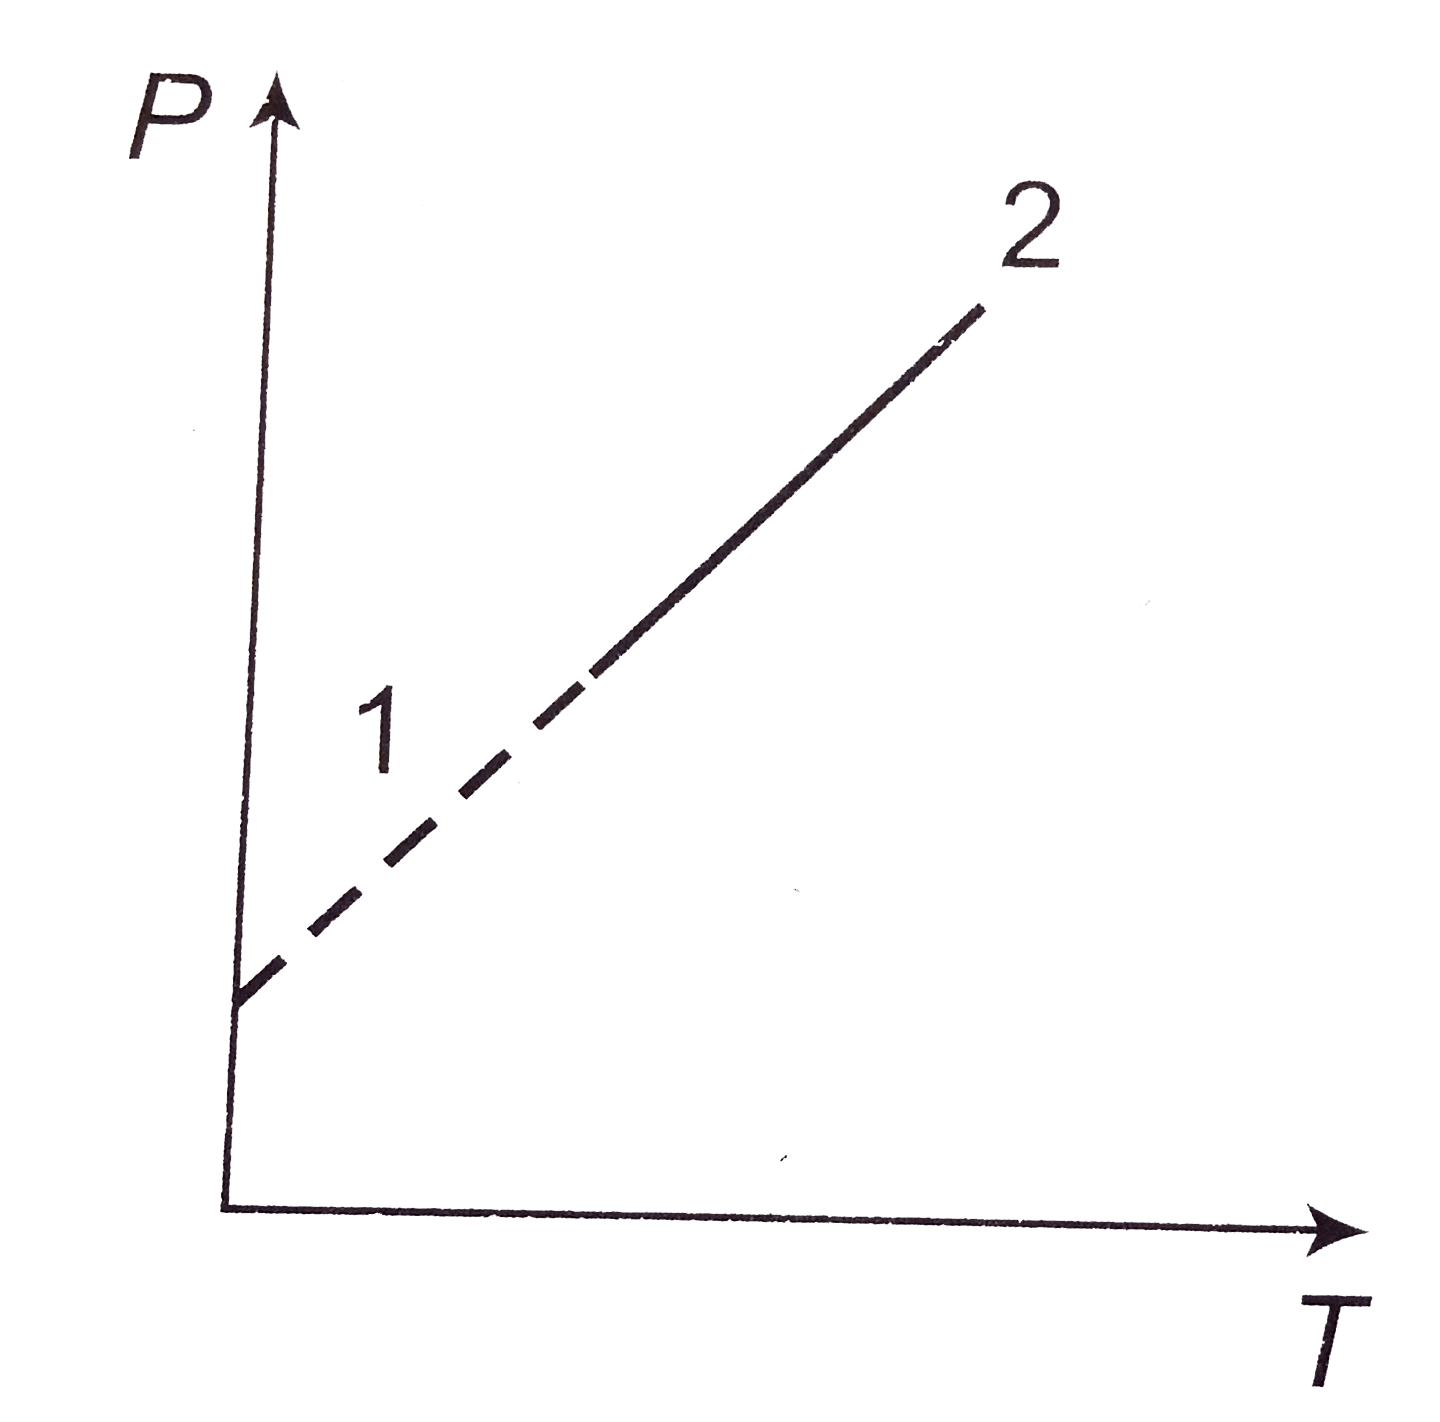
A pressure P, absolute temperature T, graph was obtained whe a given mass of a gas heated. During the heating process from the state 1 to the state 2, the volumeAremained sameBdecreasedCincreasedDnoneV−T diagram for a process of given mass of ideal gas is as shown in fig. During the process pressure of the gas
_E01_072_Q01.png) AFirst increases then decreasesBFirst decreases then increasesCcontinously decreasesDcontinously increases
AFirst increases then decreasesBFirst decreases then increasesCcontinously decreasesDcontinously increases
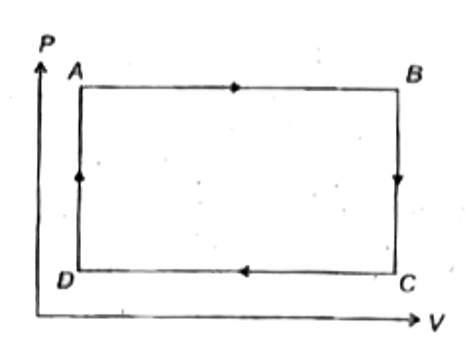
The pressure and volume of a gas changed as shown in the P-V diagram in this figure. The temperature of the gas will
View Solution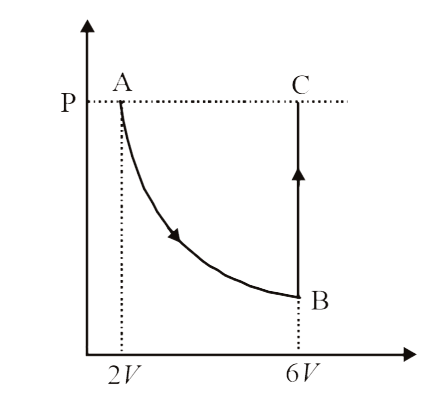
In the figure n mole of a monoatomic ideal gas undergo the process ABC as shown in the P-V diagram. The process AB is isothermal and BC is isochoric. The temperature of the gas at A is T0 total heat given to the gas during the process ABC is measured to be
Q. The average molar heat capacity of the gas in process ABC is
View Solution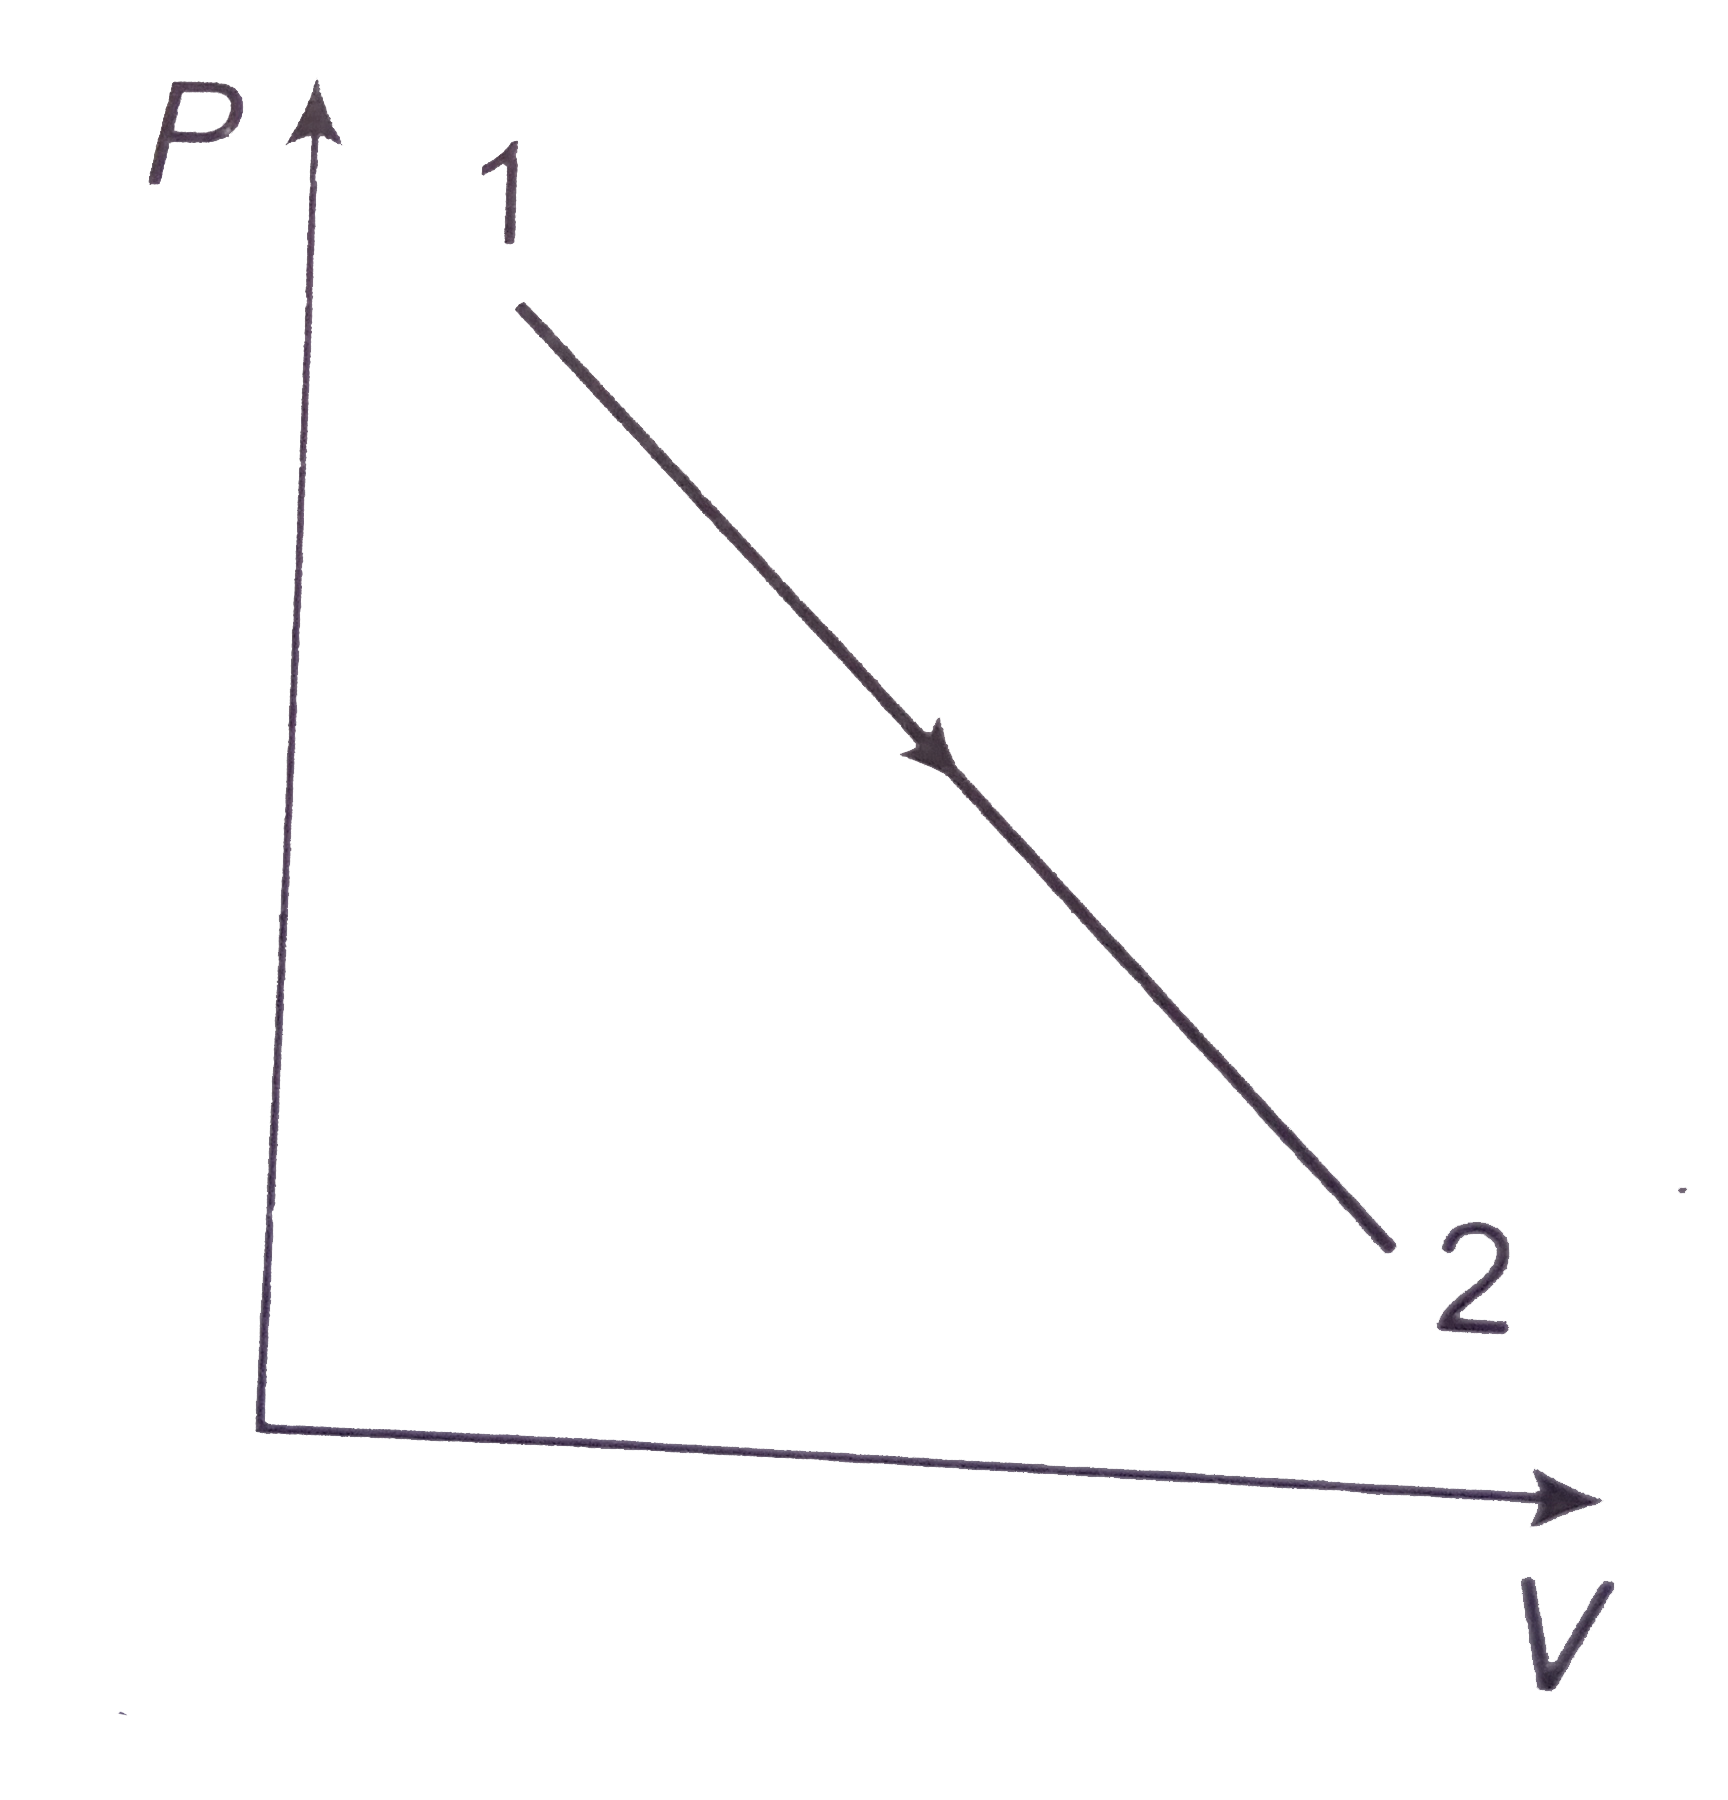
P−V graph was obtained from state 1 to state 2 when a given mass of a gas is subjected to temperature changes during the process the gas is
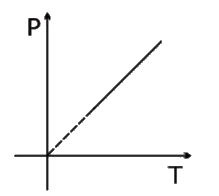
View SolutionThe pressure P of an ideal diatomic gas varies with its absolute temperature T as shown in figure. The molar heat capacity of gas during this process is [R is gas constant]
View SolutionTwo moles of an ideal monoatomic gas undergoes a cyclic process ABCA as shown in V-T diagram below:

Heat supplied to the gas during the process AB is :
View Solution
