A volume V versus pressure P graph was obtained from state 1 to state 2 when a given mass of a gas is subjected to temperature changes. During the process the gas is
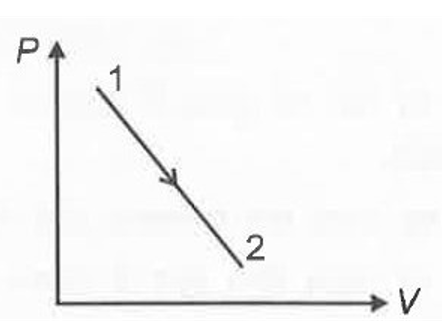
Heated in the beginning and cooled towards end
Cooled in the beginning and heated towards end
Heated continuously
Cooled continuously
Step by step video & image solution for A volume V versus pressure P graph was obtained from state 1 to state 2 when a given mass of a gas is subjected to temperature changes. During the process the gas is by Physics experts to help you in doubts & scoring excellent marks in Class 12 exams.
Updated on:21/07/2023Similar Questions
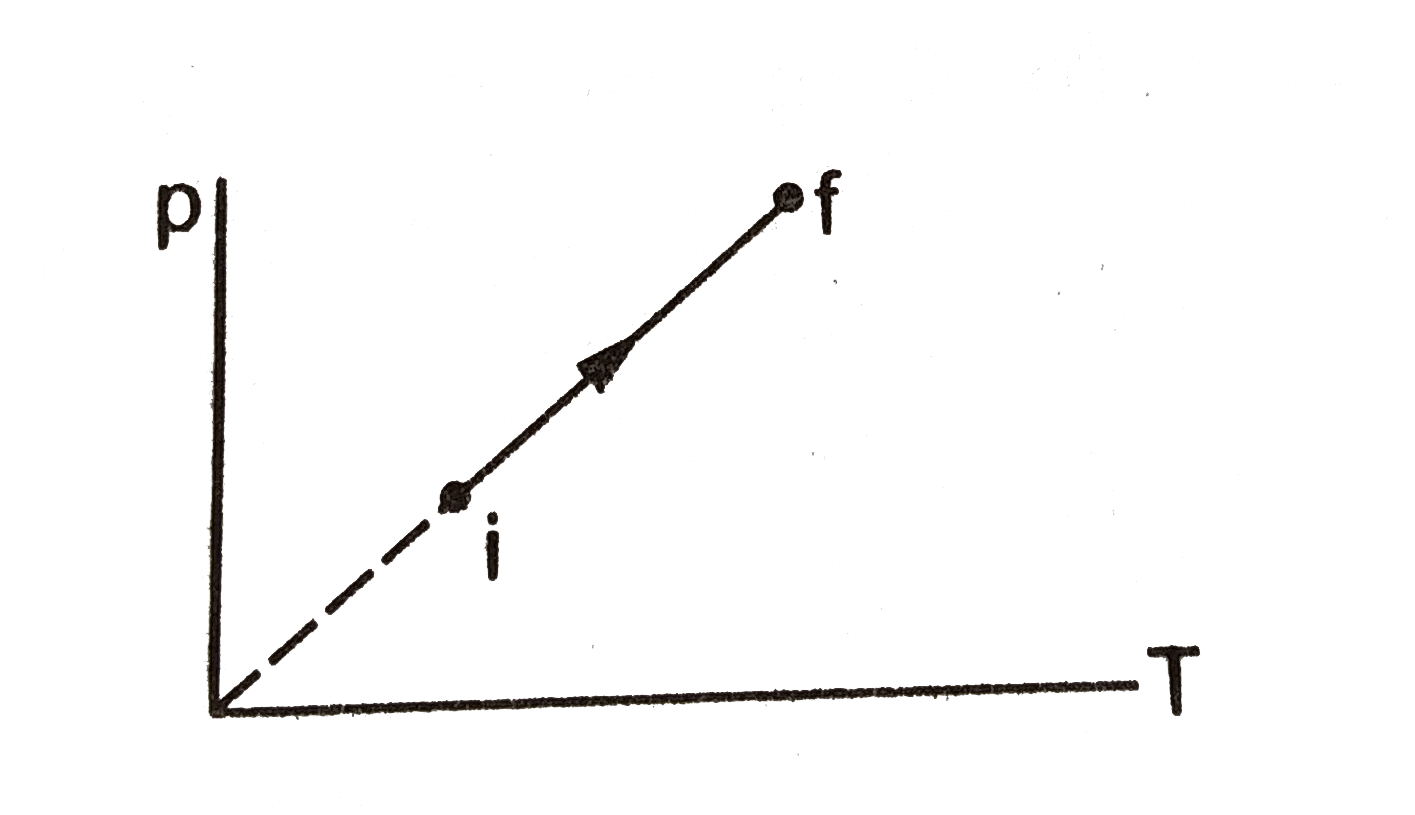
An ideal gas goes from the state i to the state ∫ as shown in .the work done by the gas during the process
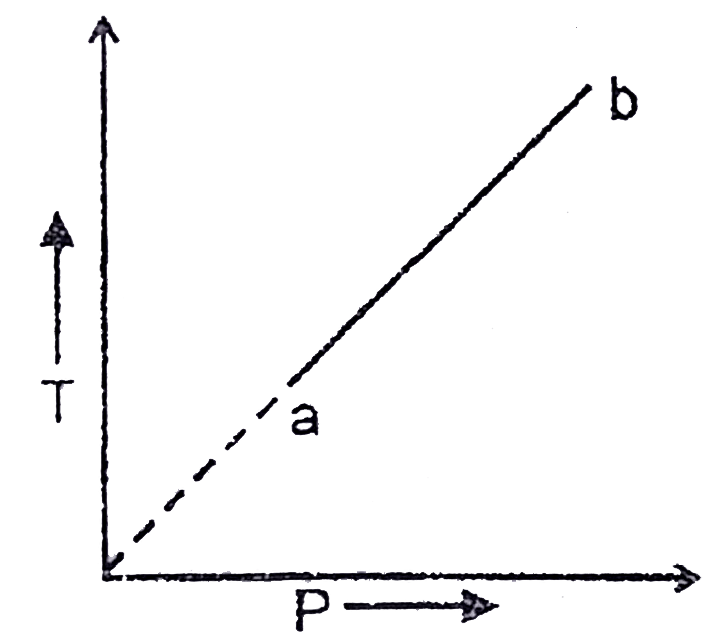
View SolutionAn ideal gas change from state a to state b as shown in Fig. what is the work done by the gas in the process?
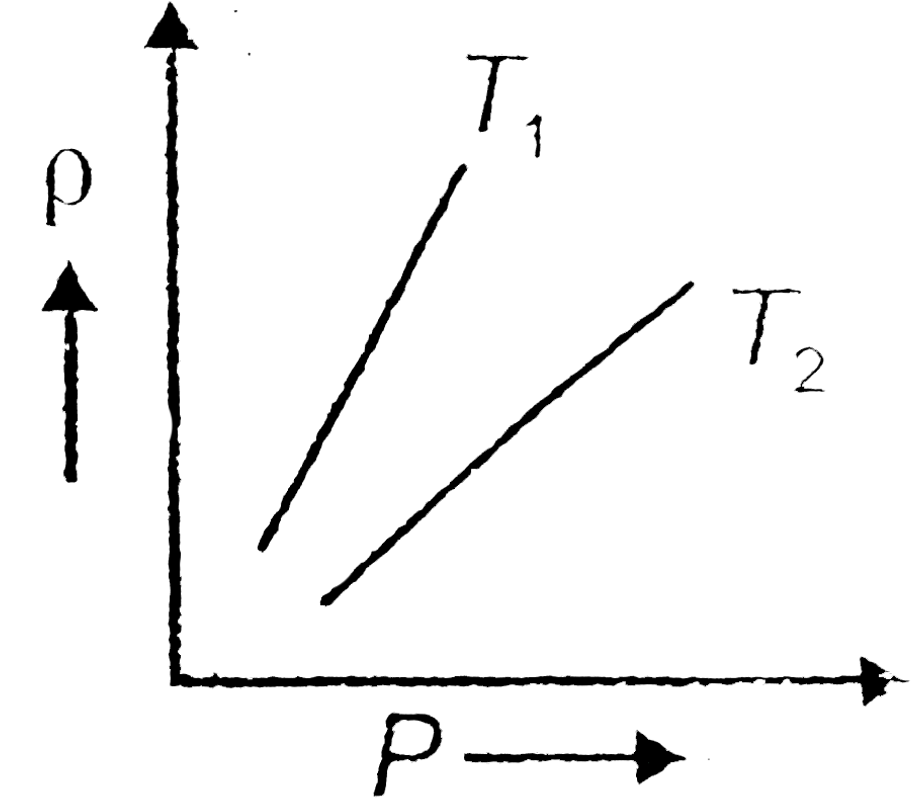
View SolutionThe density (ρ) versus pressure (P) graphs of a given mass of an ideal gas is shown at two temperatures T1andT2. Then relation between T1andT2 may be
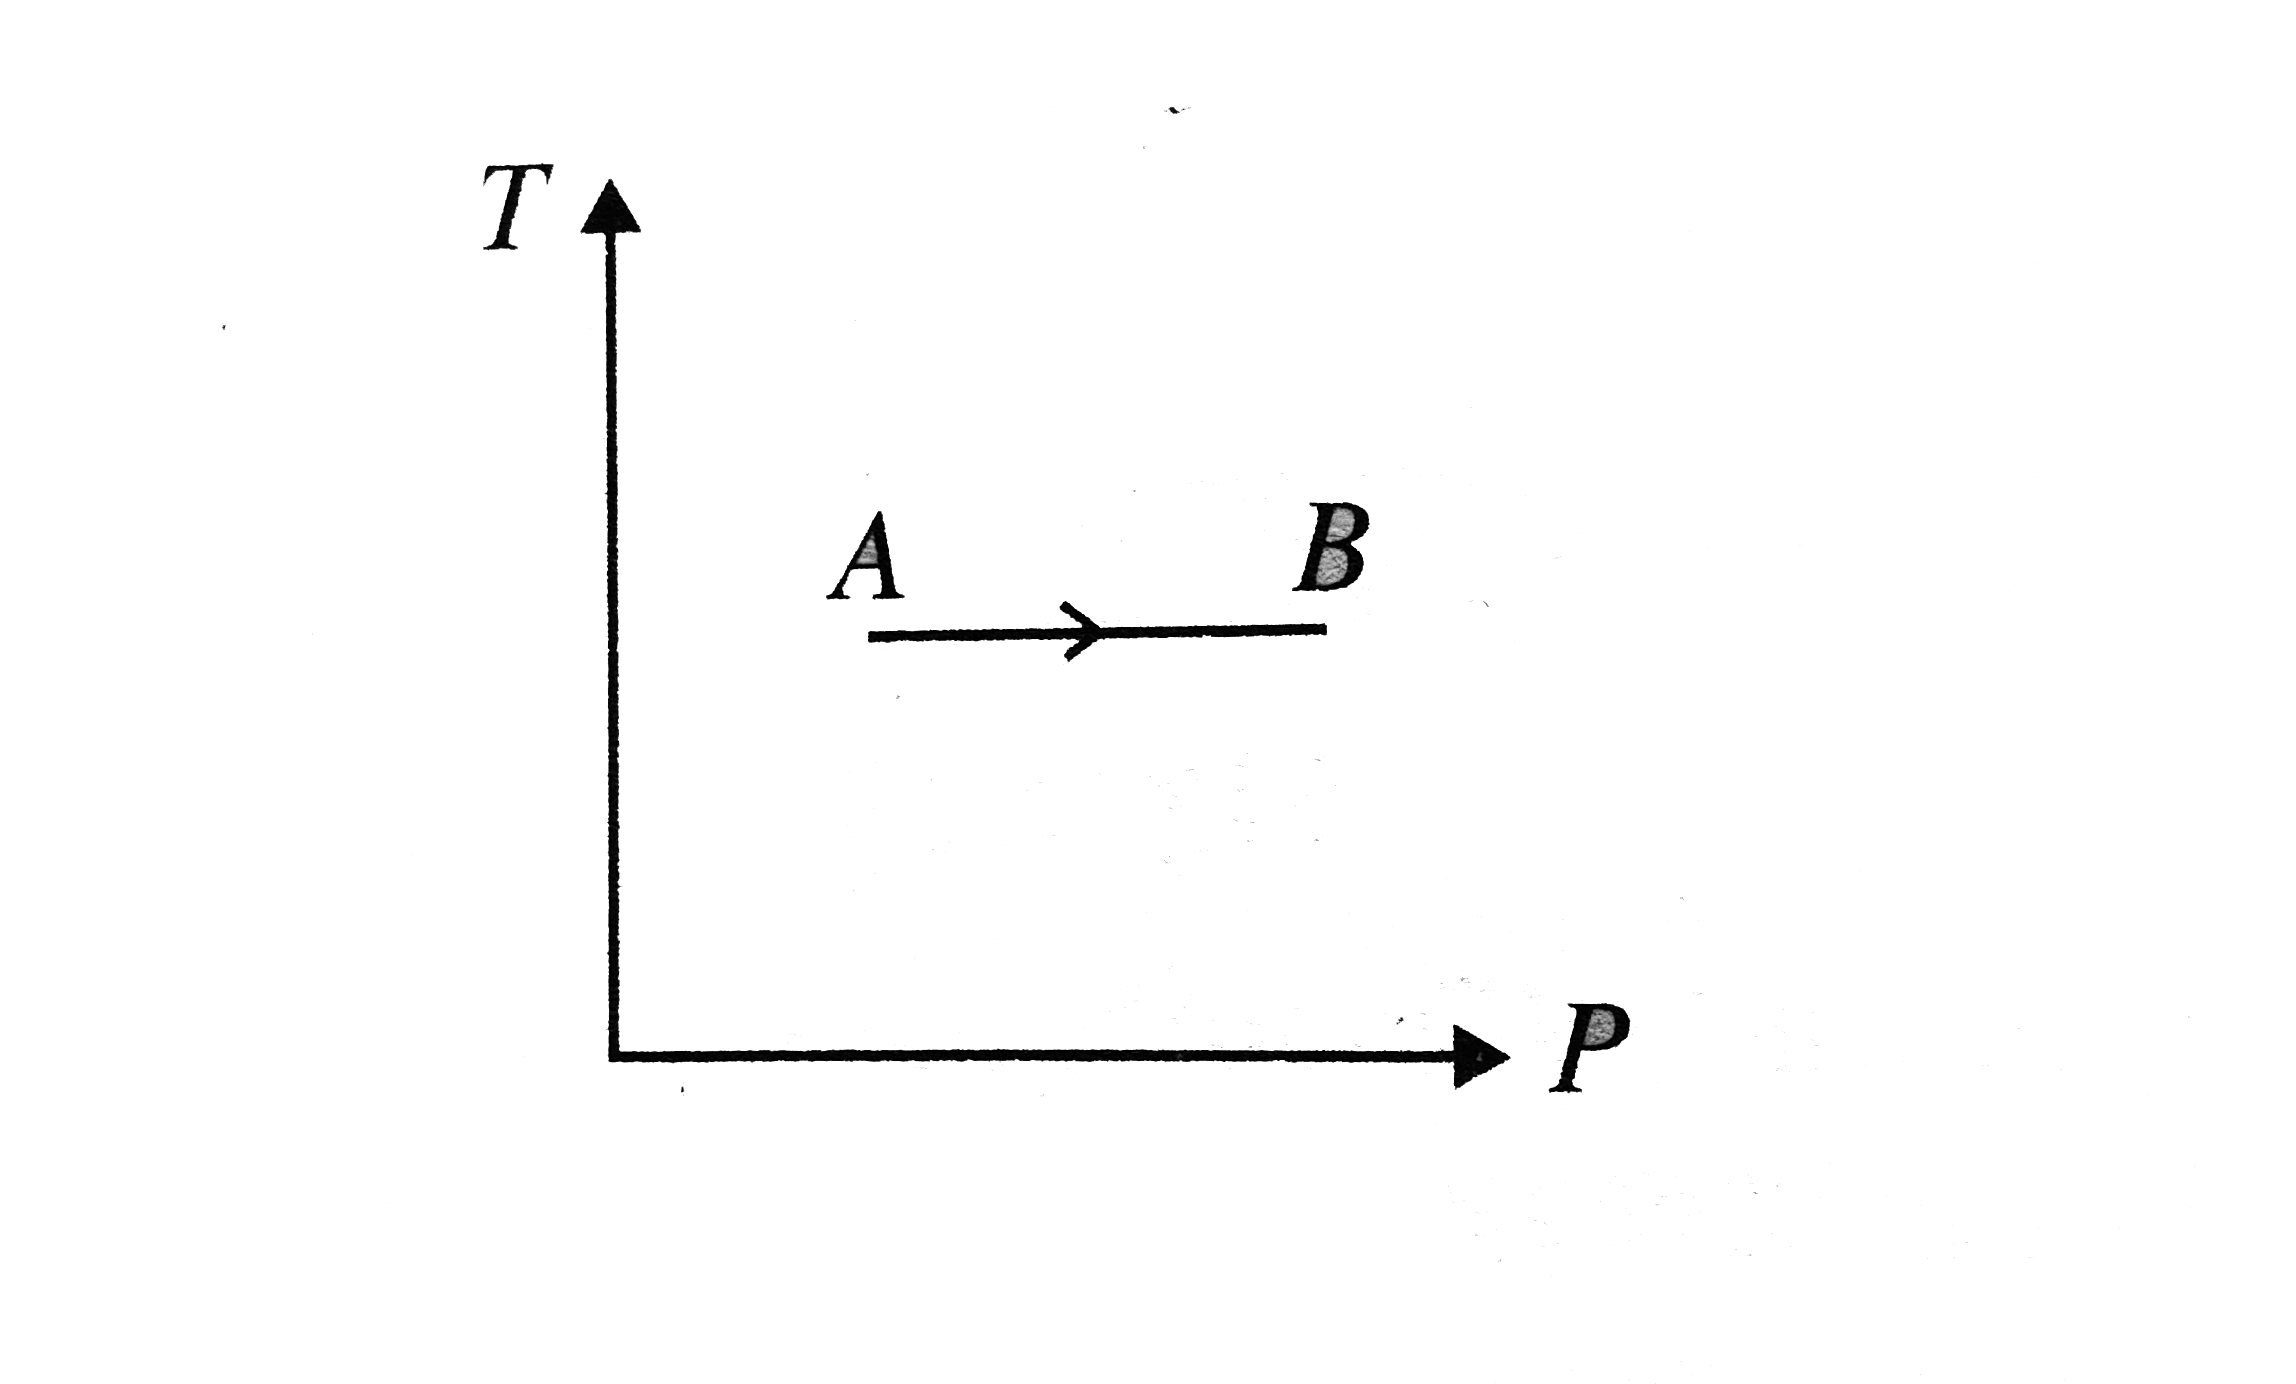
View SolutionTemperature versus pressure graph of an ideal gas is shown in Fig. During the process AB
View SolutionThe temperature of a given mass of a gas is increased from 19∘C to 20∘C at constant pressure. The volume V of the gas is
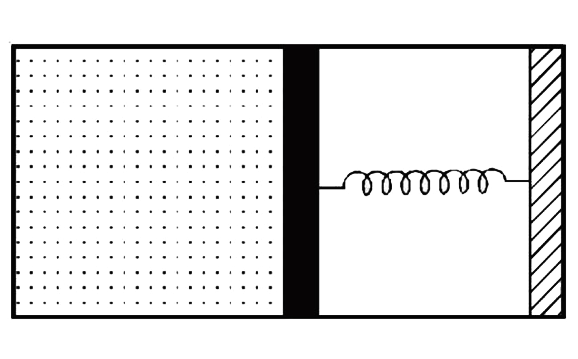
View SolutionAn ideal monoatomic gas is confined in a horizontal cylinder by a spring loaded piston (as shown in the figure). Initially the gas is at temperature T1, pressure P1 and volume V1and the spring is in its relaxed state. The gas is then heated very slowly to temperature T2,pressure P2and volume V2. During this process the piston moves out by a distance x. Ignoring the friction between the piston and the cylinder, the correct statement (s) is (are)
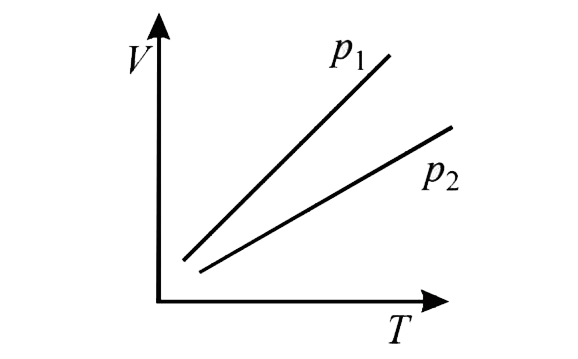
View SolutionThe volume V versus temperature T graphs for a certain amount of a perfect gas at two pressure p1andp2 are as shown in Fig. It follows from the graphs that p1 is greater than p2.
View SolutionThe pressure of a given mass of a gas contained in a vessel at constant temperature is reduced to half. Calculte the change in volume of the gas
View SolutionFour moles of an ideal gas is initially in a state A having pressure 2×10⁵N/m2 and temperature 200 K . Keeping pressure constant the gas is taken to state B at temperature of 400K. The gas is then taken to a state C in such a way that its temperature increases and volume decreases. Also from B to C, the magnitude of dTdV increases. The volume of gas at state C is eaual to its volume at state A. Now gas is taken is initial state A keeping volume constant. A total of 1000 J heat is rejected from the sample in the cyclic process. Take R=8.3J/K/mol.
Which graph between temperture T and volume V for the cyclic process is correct.
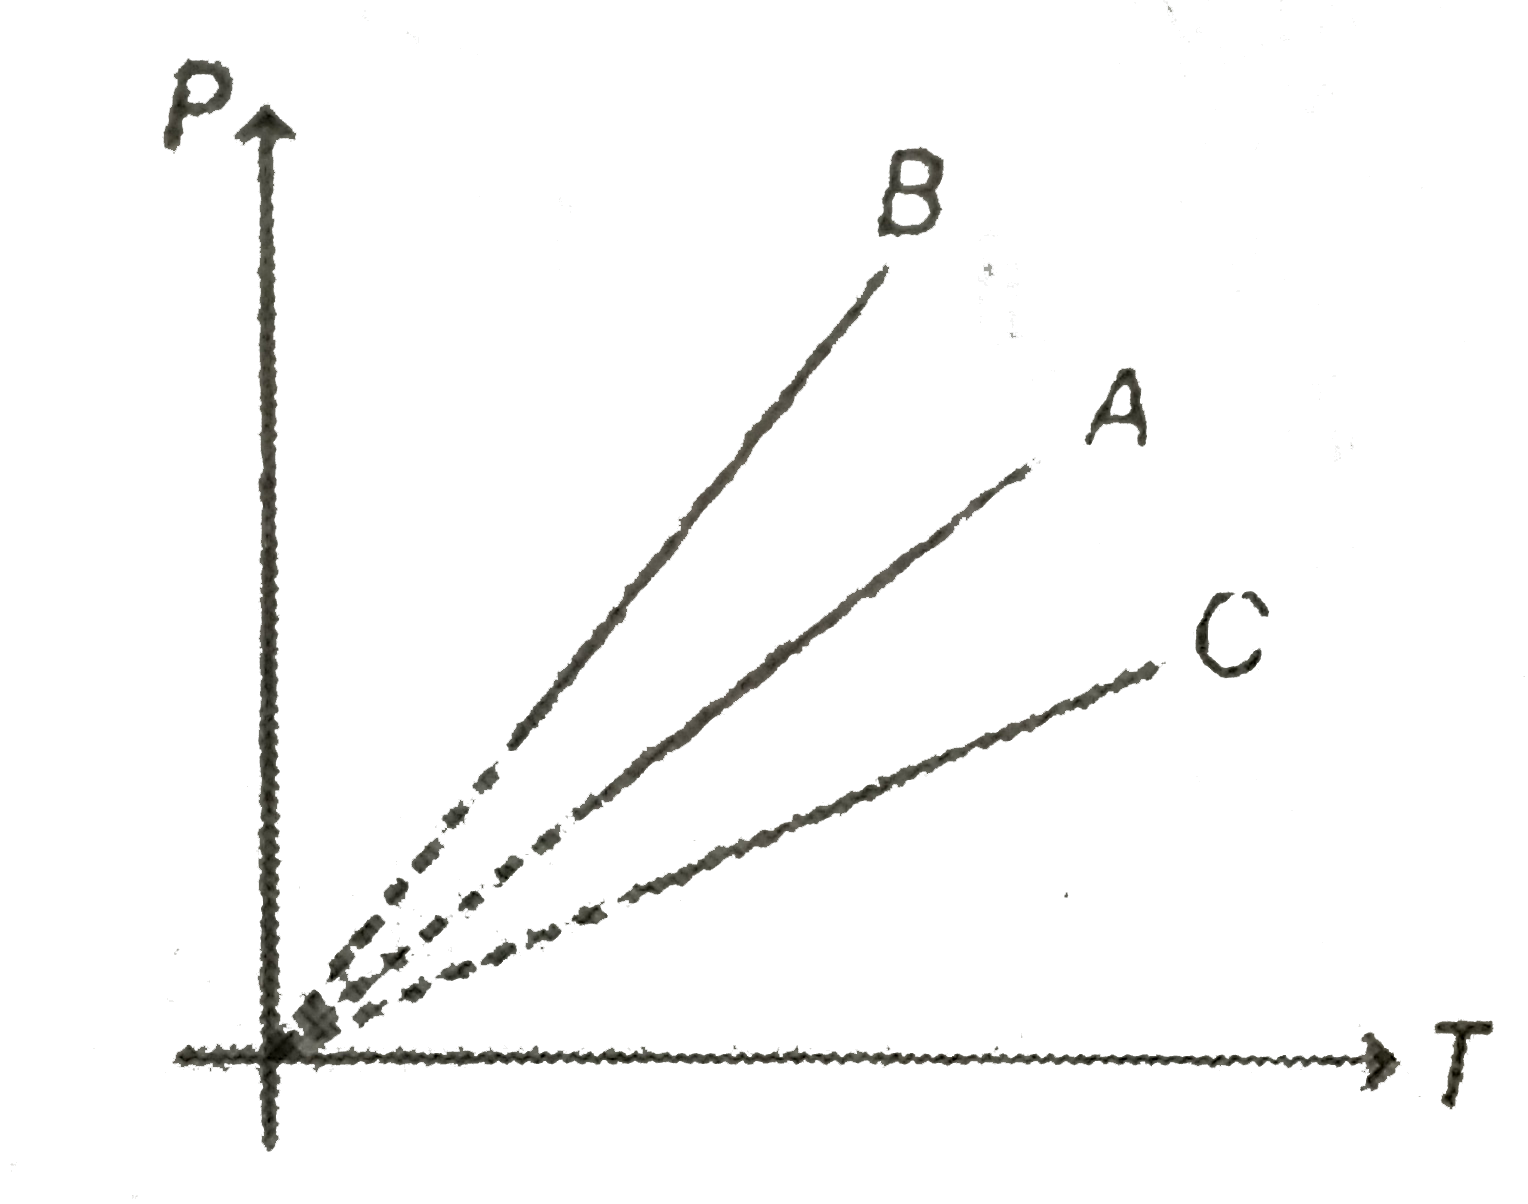
View SolutionPressure versus temperature graph of an ideal gas at constant volume V is shown by the straight line A. Now mass of the gas is doubled and the volume is halved, then the corresponding pressure versus temperature graph will be shown by the line
View Solution
