In the given diagram, the energy levels of hydrogen atom have been shown along with some transitions marked A, B, C, D and E. The transition A, B and C respectively represent : 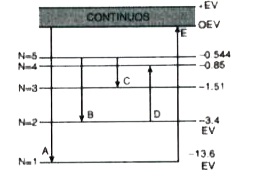
The first member of the Lyman series, third member of Balmer series and the second member of Paschen series
Second member of Balmer series, and third member of Paschen series
The series limit of Lyman series, second member of Balmer series and second member of Paschen series
The series dimit of Lyman series, third member of Baltner series and second member of Paschen series
The correct Answer is:D
En2−Eni=hv−hcλ
2E−E=hcλ
Also, 4E3−E=hcλ
or E=hcλorE3=hcλ.
Dividing we get 3 =λ.λ,λ.=3λ
Topper's Solved these Questions
- ATOMS, MOLECULES AND NUCLEIBOOK - MODERN PUBLICATIONCHAPTER - ATOMS, MOLECULES AND NUCLEIEXERCISE - MCQ (Level -II)
77 Videos
- ATOMS, MOLECULES AND NUCLEIBOOK - MODERN PUBLICATIONCHAPTER - ATOMS, MOLECULES AND NUCLEIEXERCISE - MCQ (Level -III)
9 Videos
- 15 MAGNETIC EFFECTS OF CURRENTSBOOK - MODERN PUBLICATIONCHAPTER - 15 MAGNETIC EFFECTS OF CURRENTSEXERCISE - Recent Competitive Questions
31 Videos
- CURRENT ELECTRICITYBOOK - MODERN PUBLICATIONCHAPTER - CURRENT ELECTRICITYEXERCISE - RECENT COMPETITIVE QUESTIONS
32 Videos
Similar Questions
In the following figure the energy levels of hydroge atom have been shown along with some transitions marked A, B,C,D and E.The transitionsy A,B and C respectively represent:
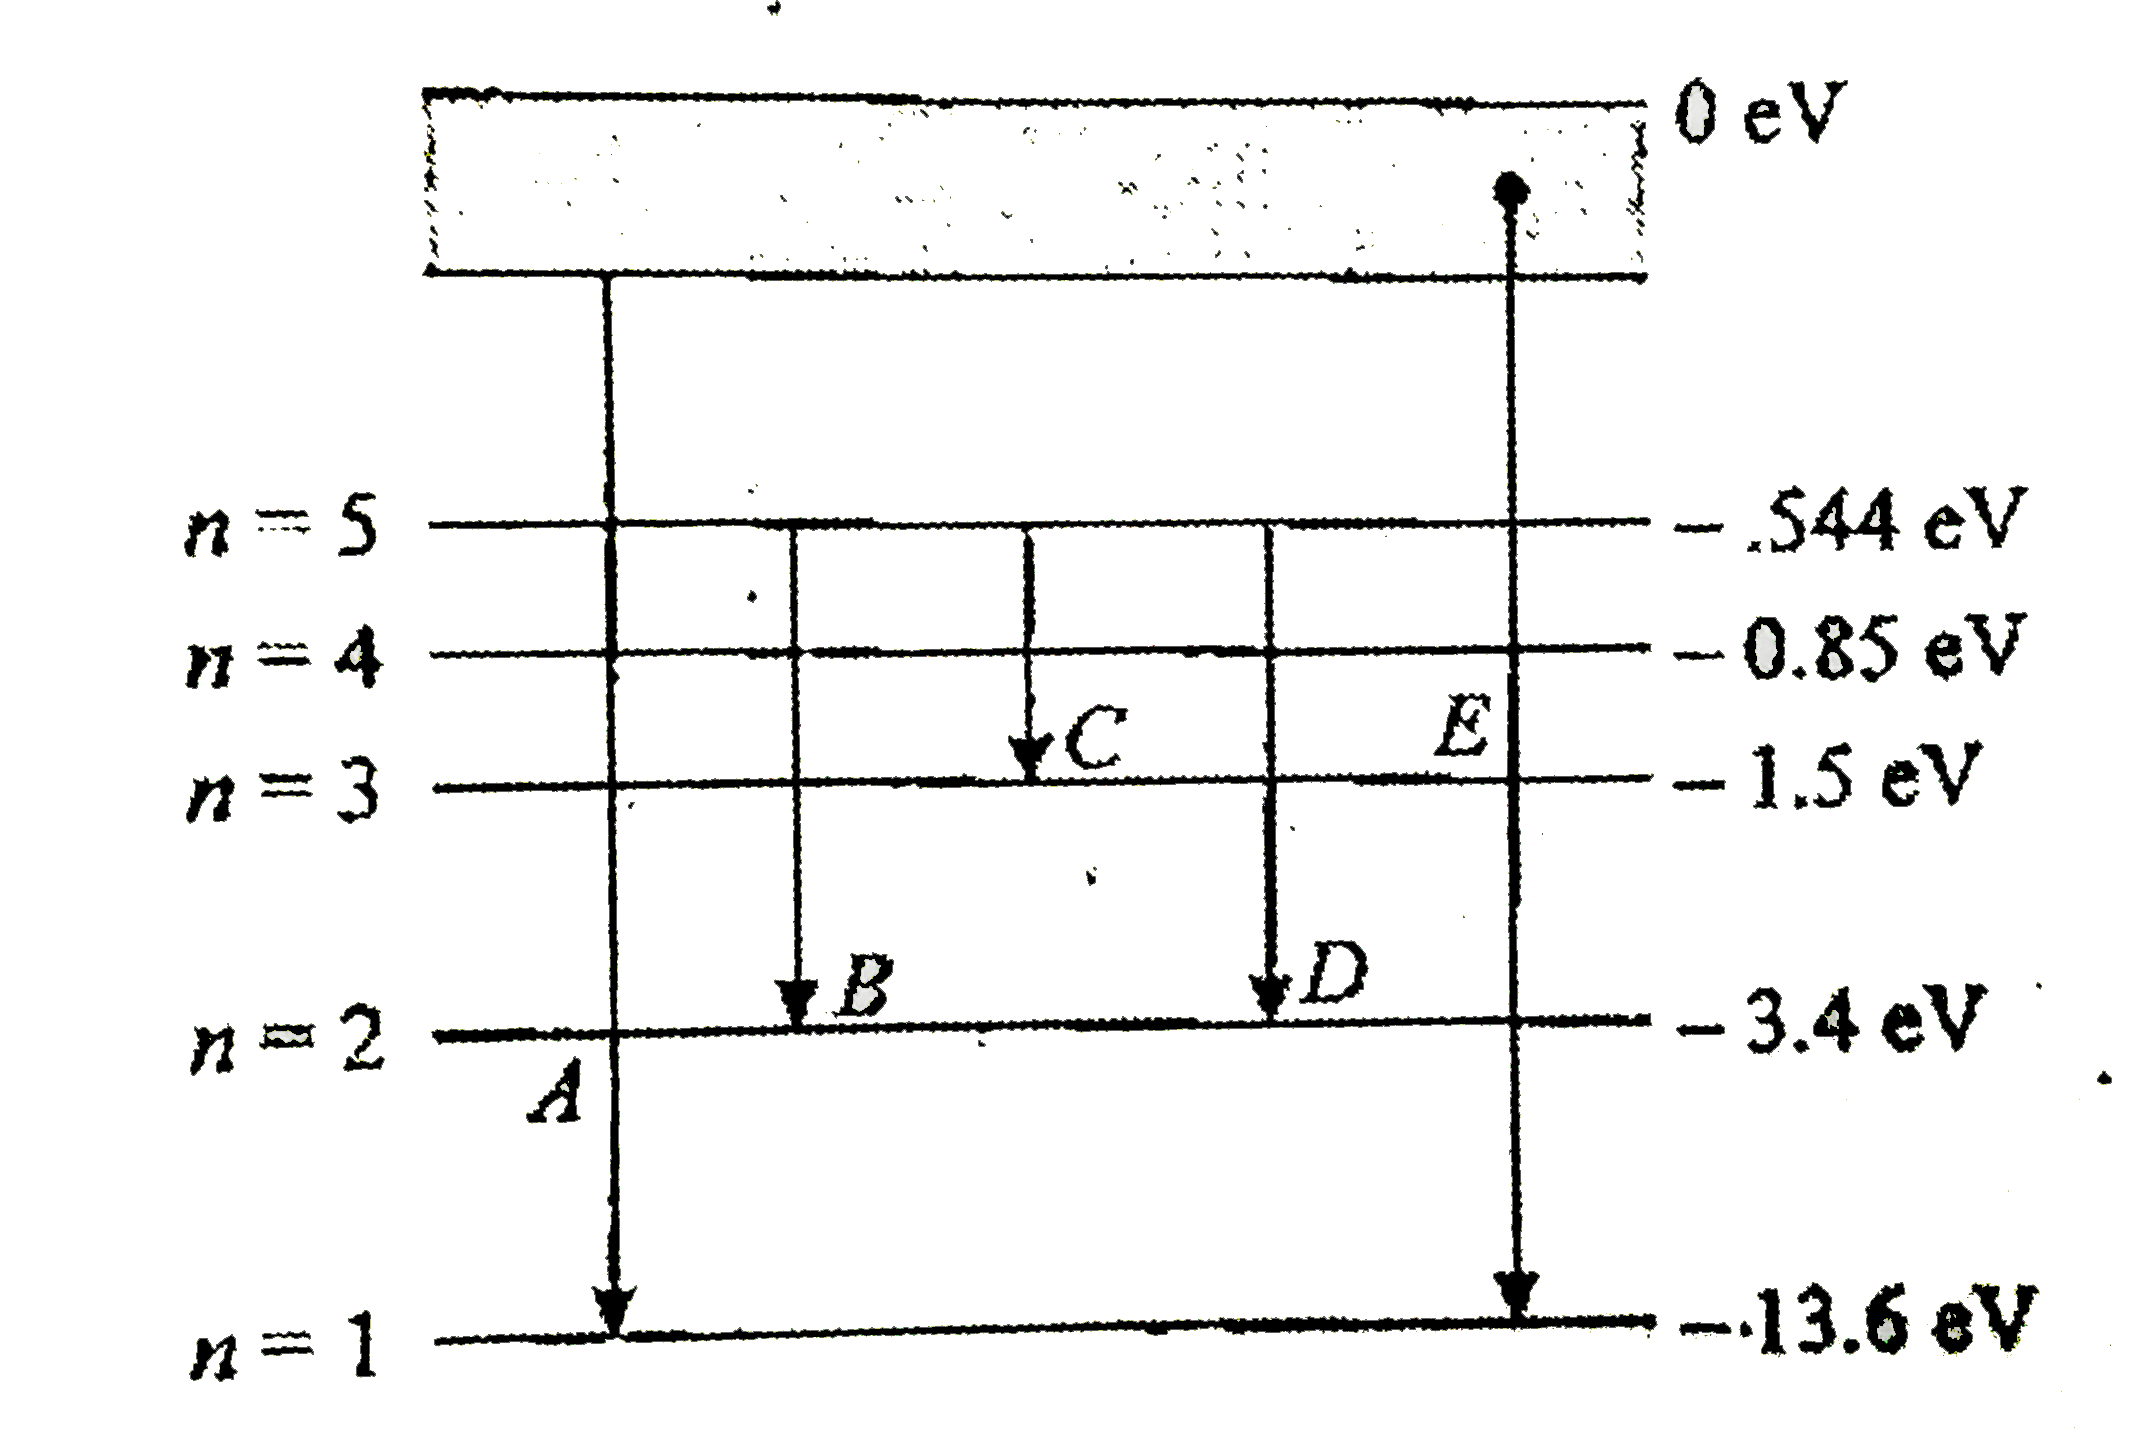
View SolutionIn the following figure the energy levels of hydroge atom have been shown along with some transitions marked A, B,C,D and E.The transitionsy A,B and C respectively represent:

View Solution
Knowledge Check
In the following figure the energy levels of hydroge atom have been shown along with some transitions marked A, B,C,D and E.The transitionsy A,B and C respectively represent:
 AThe ionization potential of hydrogen, second member of Balmer series and third member of Paschen series.BThe first member of the Lyman series, third member of Balmer series and second member of Paschen series.CThe series limit of Lyman series, third member of Balmer series and second member of Paschen series.DThe series limit of Lyman series, second member of Balmer series and second member of Paschen series.
The energy levels of the hydrogen spectrum is shown in figure. There are some transitions A,B,C,D and E. Transition A,B, and C respectively represent
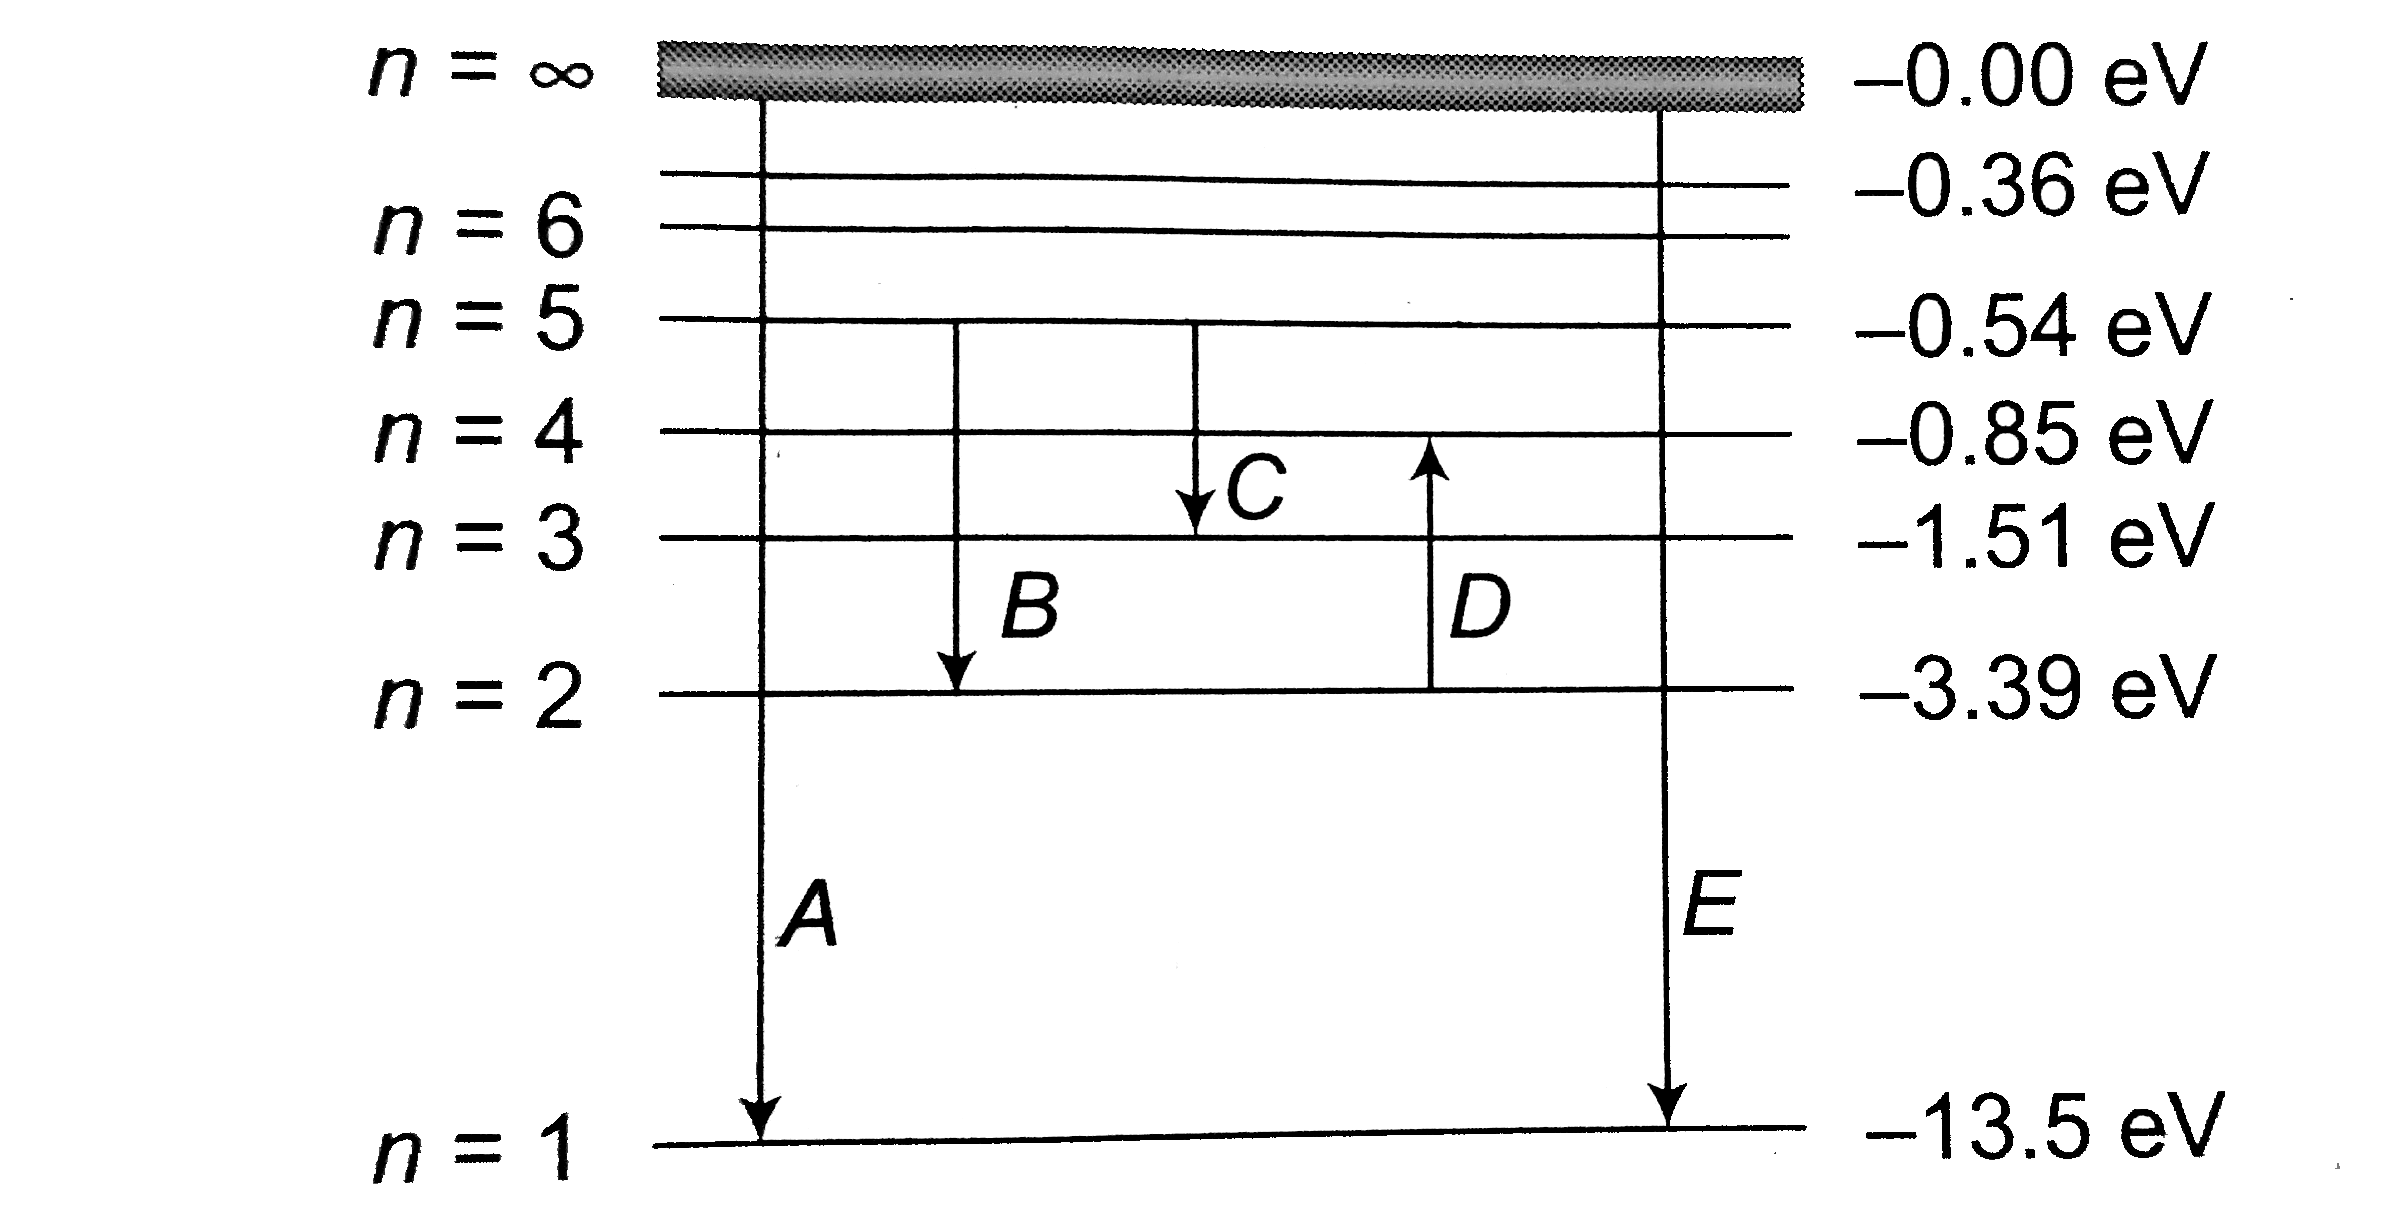 AFirst mumber of Lyman series, third spectual line of Balmer series and the second spectral line of Paschen seriesBIonization potential of hydrogen, second spectral line of Balmer series and third spectral line of Paschen seriesCSeries limit of Lyman series, third spectral line of Balmer series and second spectral line of Paschen seriesDSeries limit of Lyman series, second spectral line of Balmer series and third spectral line of Paschen series
The given diagram shows axon terminal and synapse. Here A,B,C,D and E respectively represent
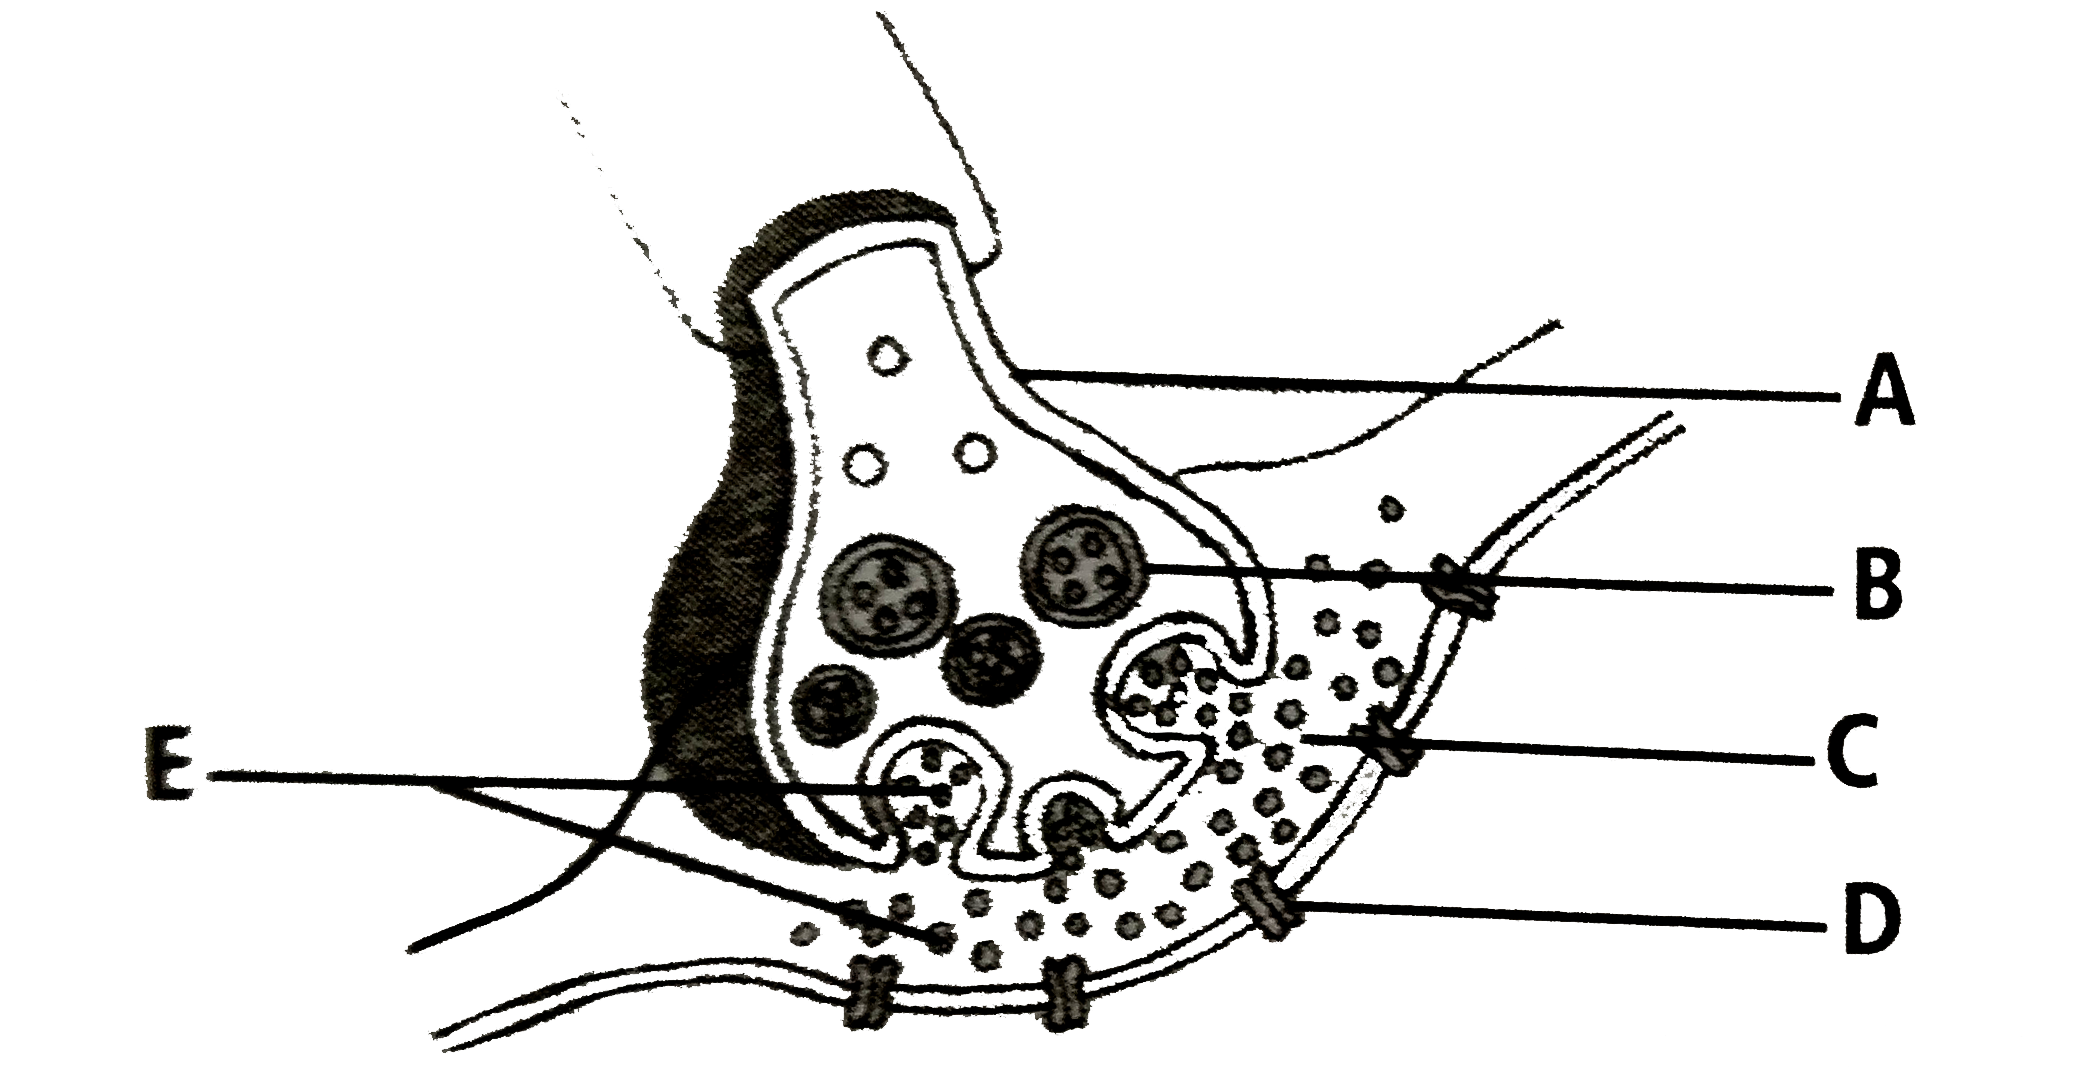 AAxon terminal, Synaptic cleft, Synaptic versicles, Neurotransmitters and ReceptorsBAxon terminal, Synaptic vesicles, Synaptic cleft, Receptors and NeurotransmittersCSynaptic cleft, Synaptic vesicles, Axon terminal, Neurotransmitters and ReceptorsDSynaptic cleft, Axon terminal, Synaptic vesicles, Neurotransmitters and Receptors
In given diagram A, B, C and D respectively represents :-
View SolutionDraw a neat labelled energy level diagram for H-atom showing the transitions.
View SolutionDraw a neat, labelled energy level diagram for H atom showing the transitions.
Explain the series of spectral lines for H atom. Whose fixed inner orbit numbers are 3 and 4 respectively.
The work function for potassium and caesiumare 2.25 eV and 2.14 eV respectively. Is the photoelectric effect possible for either of them if incident wavelength is 5180 Å ?
[Given : Planck's constant =6.63×10⁻³⁴J.s., Velocity of light =3×10⁸m/s,1eV=1.6×10−19J]
View SolutionSketch the energy level diagram for hydrogen atom and mark the transitions for different spectral series of hydrogen.
View SolutionThe given diagram shows axon terminal and synapse. Here A,B,C,D and E respectively represent

View Solution
