Study the figures (a) and (b) given below and answer the questions given after the graphs.

i. Under the influence of which type of natural selection would graph (a) become like graph (b)?
ii. What could be the likely reasons of new variations arising in the population?
iii. Who suggested natural selection as a mechanism of evolution?
i. This is disruptive selection. It is just opposite of stabilising selection. i.e., the extremes are more adaptable than the average ones.
ii. Population becomes adapted if its individuals have some new trait (genetic variation) which suits the changed environment and is selected by nature on this basis. That is spread by differential reproduction and in time becomes a standard feature of a section of the population. This is the unit of evolutionary change.
iii. Darwin and Wallace suggested natural selection as a mechanism of evolution.
Topper's Solved these Questions
- CBSE QUESTIONS BOOK - NEW JOYTHI PUBLICATIONCHAPTER - CBSE QUESTIONS EXERCISE - HUMAN HEALTH AND DISEASE
5 Videos
- CBSE QUESTIONS BOOK - NEW JOYTHI PUBLICATIONCHAPTER - CBSE QUESTIONS EXERCISE - MICROBES IN HUMAN WELFARE
4 Videos
- CBSE QUESTIONS BOOK - NEW JOYTHI PUBLICATIONCHAPTER - CBSE QUESTIONS EXERCISE - MOLECULAR BASIS OF INHERITANCE
5 Videos
- BIOTECHNOLOGY AND ITS APPLICATIONSBOOK - NEW JOYTHI PUBLICATIONCHAPTER - BIOTECHNOLOGY AND ITS APPLICATIONSEXERCISE - CONTINUOUS EVALUATION
3 Videos
- ECOSYSTEM BOOK - NEW JOYTHI PUBLICATIONCHAPTER - ECOSYSTEM EXERCISE - Continuous Evaluation (Project)
2 Videos
Similar Questions
Study the given figures (a ) and (b) and answer the questions given below :
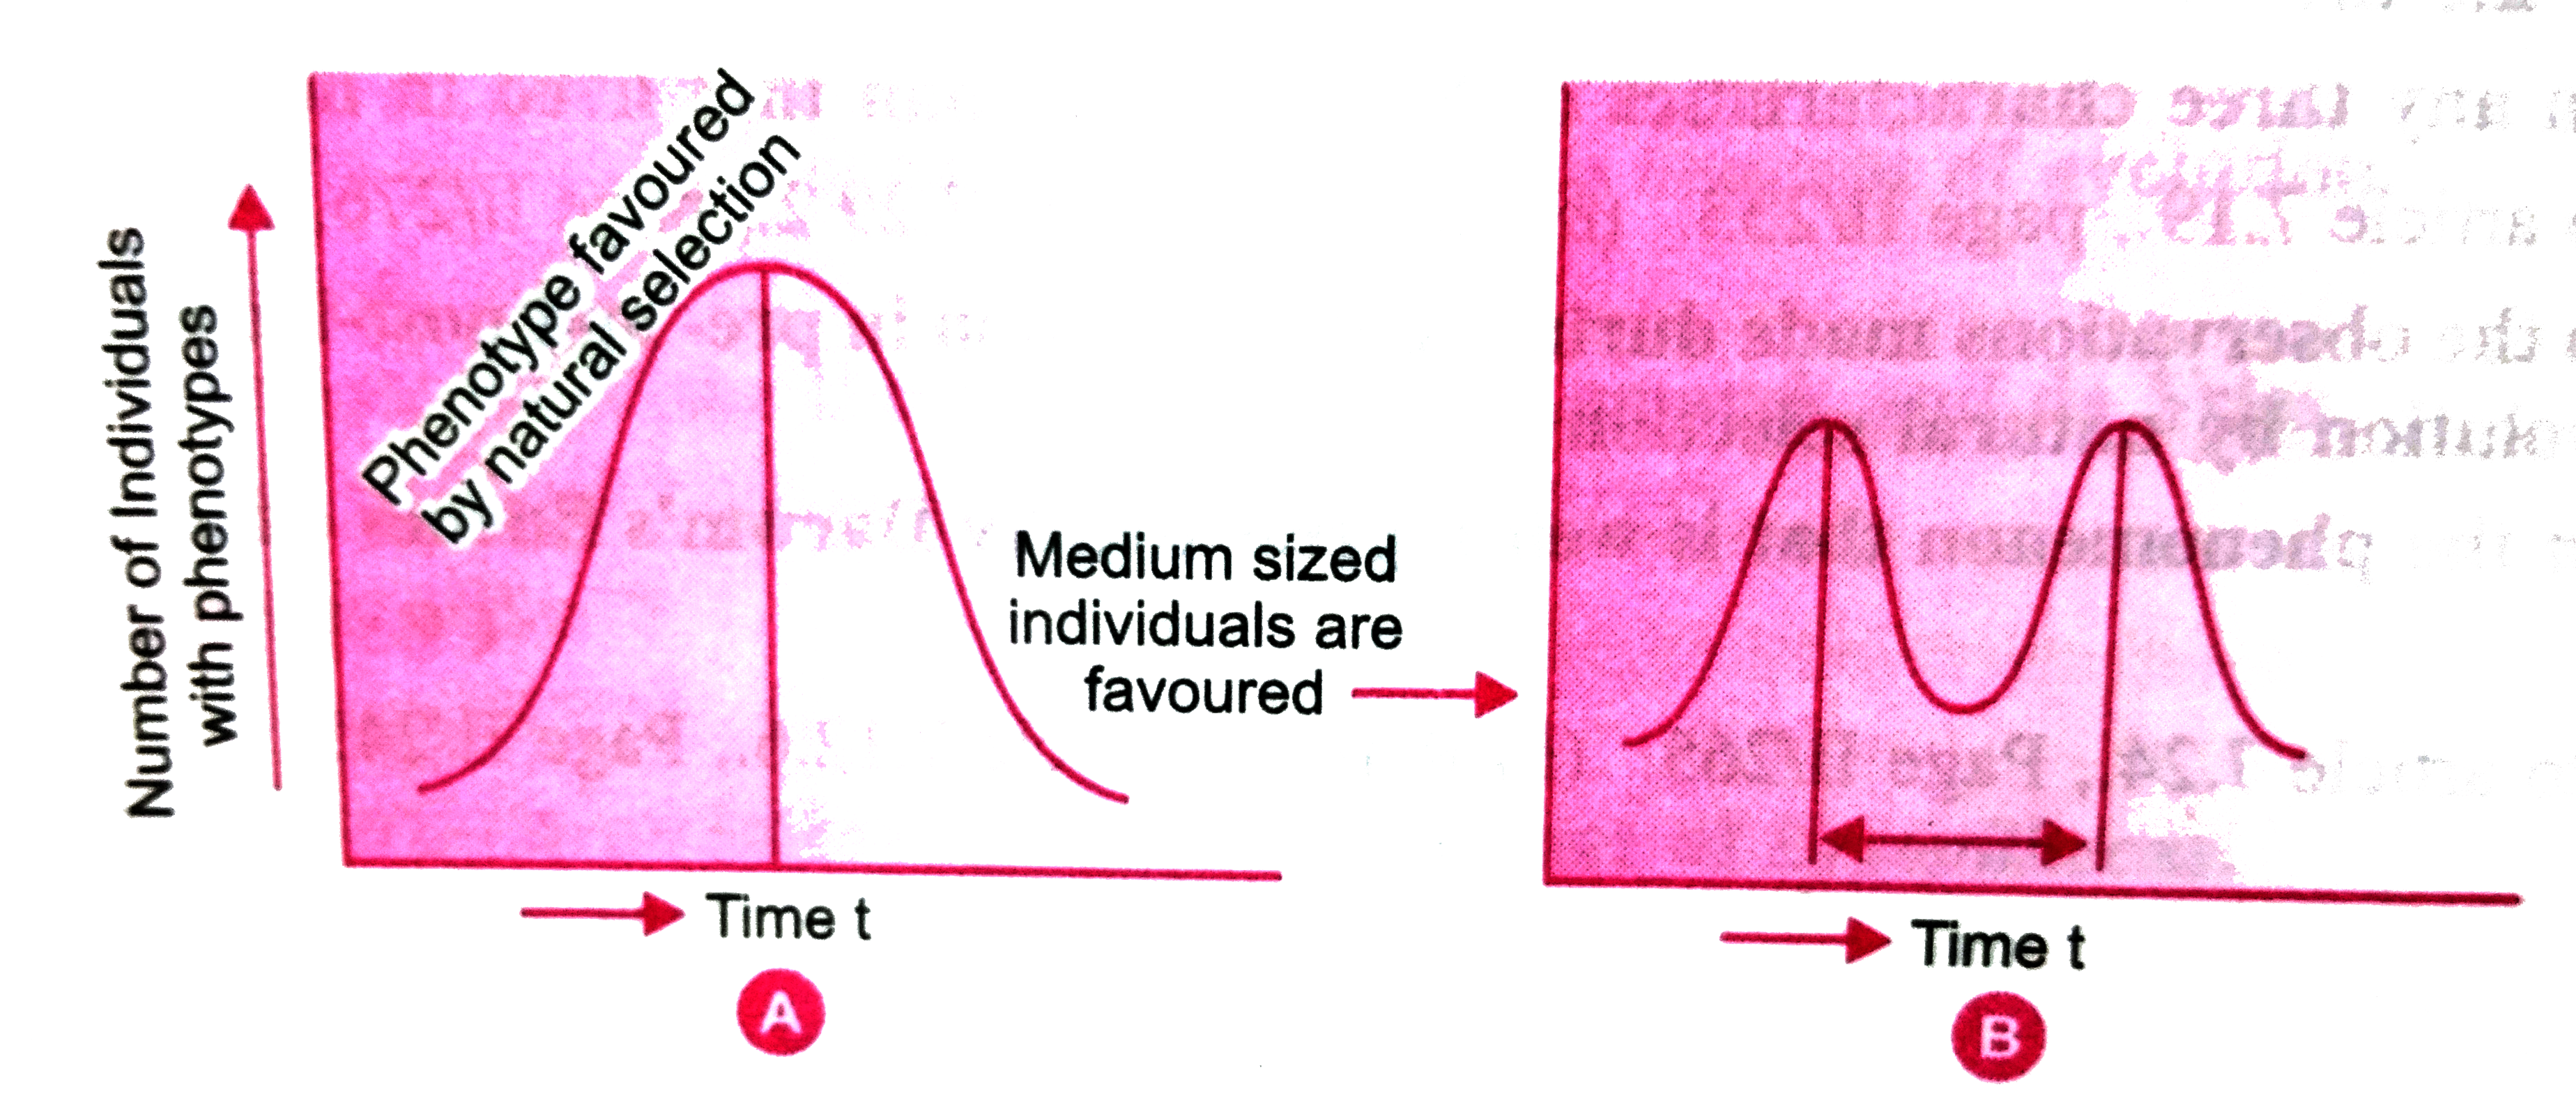
(i)Under the influence of which type of natural selection would graph (a) become like graph (b) ?
(ii)what could be the likely reasons of new variations arising in the population ?
(iii)Who suggested natural selection as a mechanism of evolution ?
View SolutionStudy the figures (A) and (B) given below and answer the questions that follow:
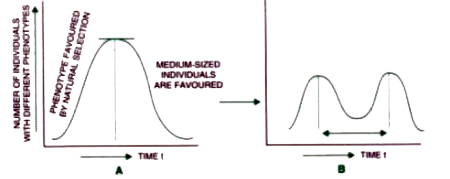
Under the influence of which type of Natural Selection would graph (A) become like graph (B)?
View Solution
Knowledge Check
Study the following graph carefully and answer the questions given below
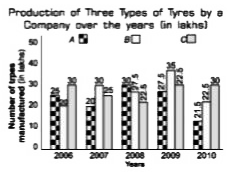
What was the difference between the number of B type tyres manufactured in 2008 and 2009?A100000B2000000C1000000Dnone to theseStudy the following graph carefully and answer the questions given below
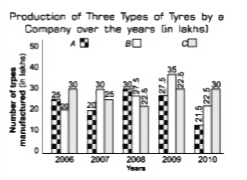
What was the percentage drop in the number of C type tyres manufactured from 2007 to 2008?A25%B10%C15%D2.5%Study the following graph carefully and answer the questions given below
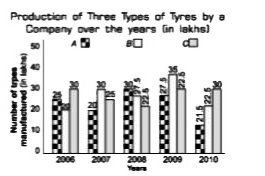
The total number of all the three types of tyres manufactured was the least in which of the following years?A2009B2010C2006D2008
Study the figures (A) and (B) given below and answer the questions that follow:
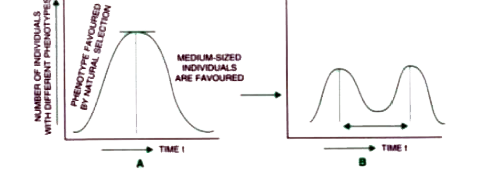
Who suggested Natural Selection as a mechanism of evolution?
View SolutionStudy the figures (A) and (B) given below and answer the questions that follow:
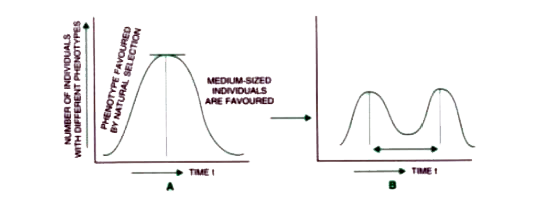
What could be the likely reasons of new variations arising in the population?
View SolutionStudy the following bar graph and answer the questions given below.
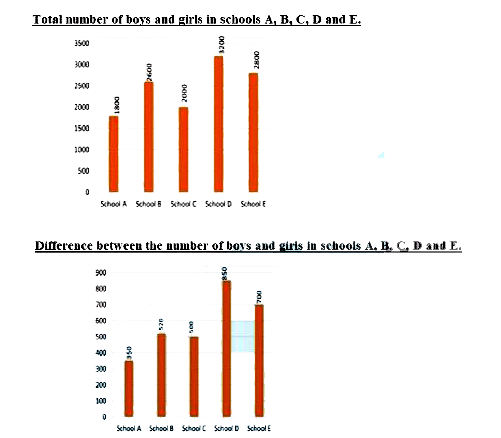
The number of boys in school B is what percentage of the total number of students in that school ?
View SolutionStudy the following graph carefully and answer the given questions.

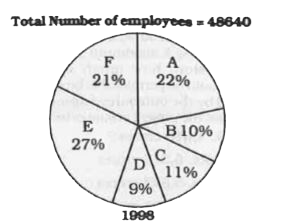
What was the approximate difference in the number of B type of employees during 1997 and 1998 ?
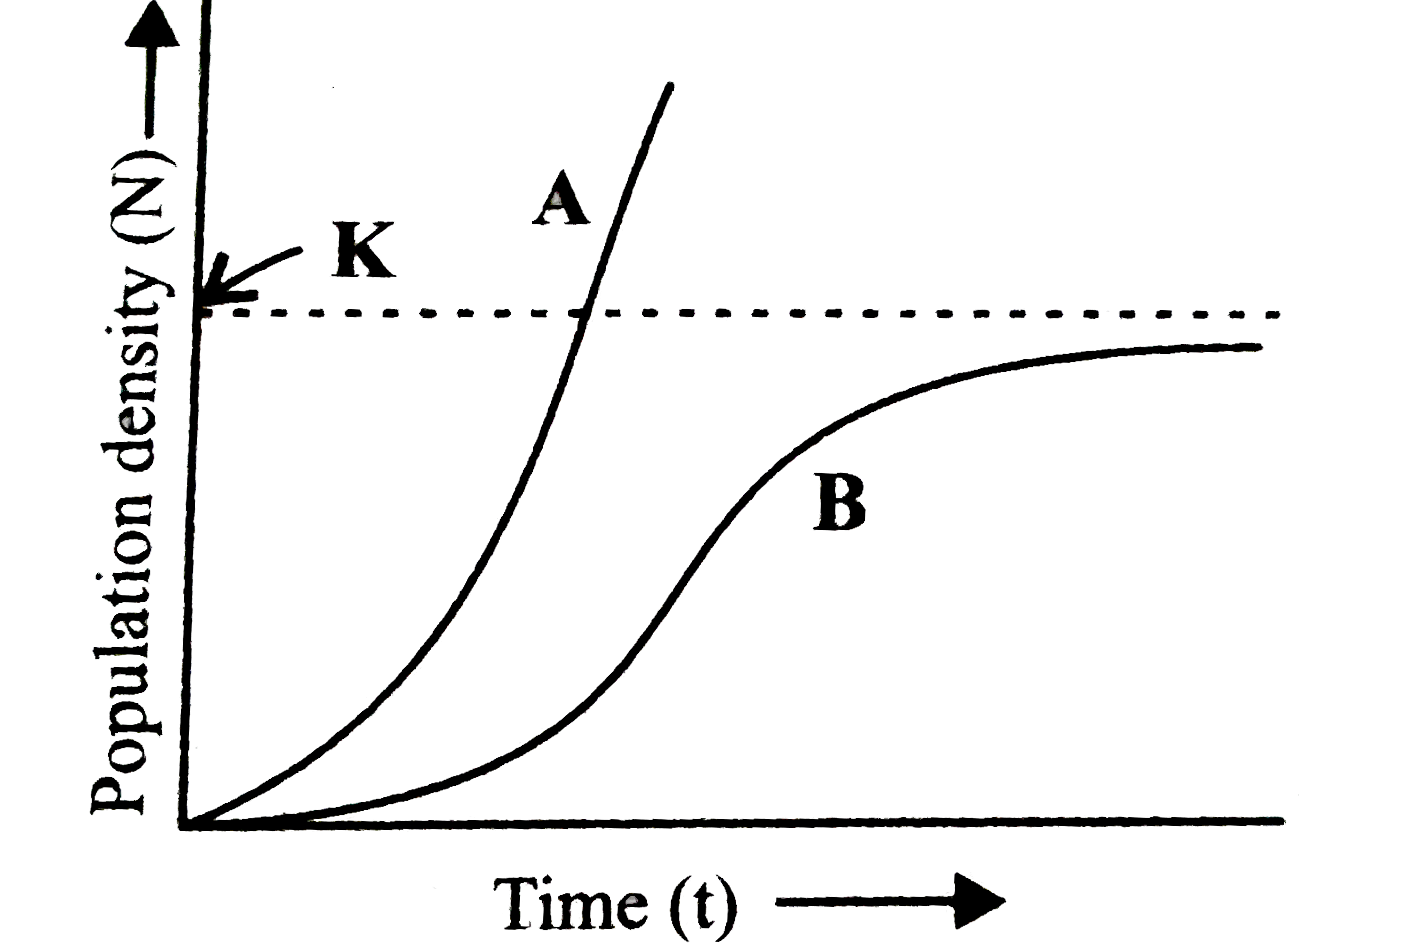
View SolutionStudy the population growth curves (A and B) in the given graph and select the incorrect option.
View Solution
