Study the given figures (a ) and (b) and answer the questions given below :
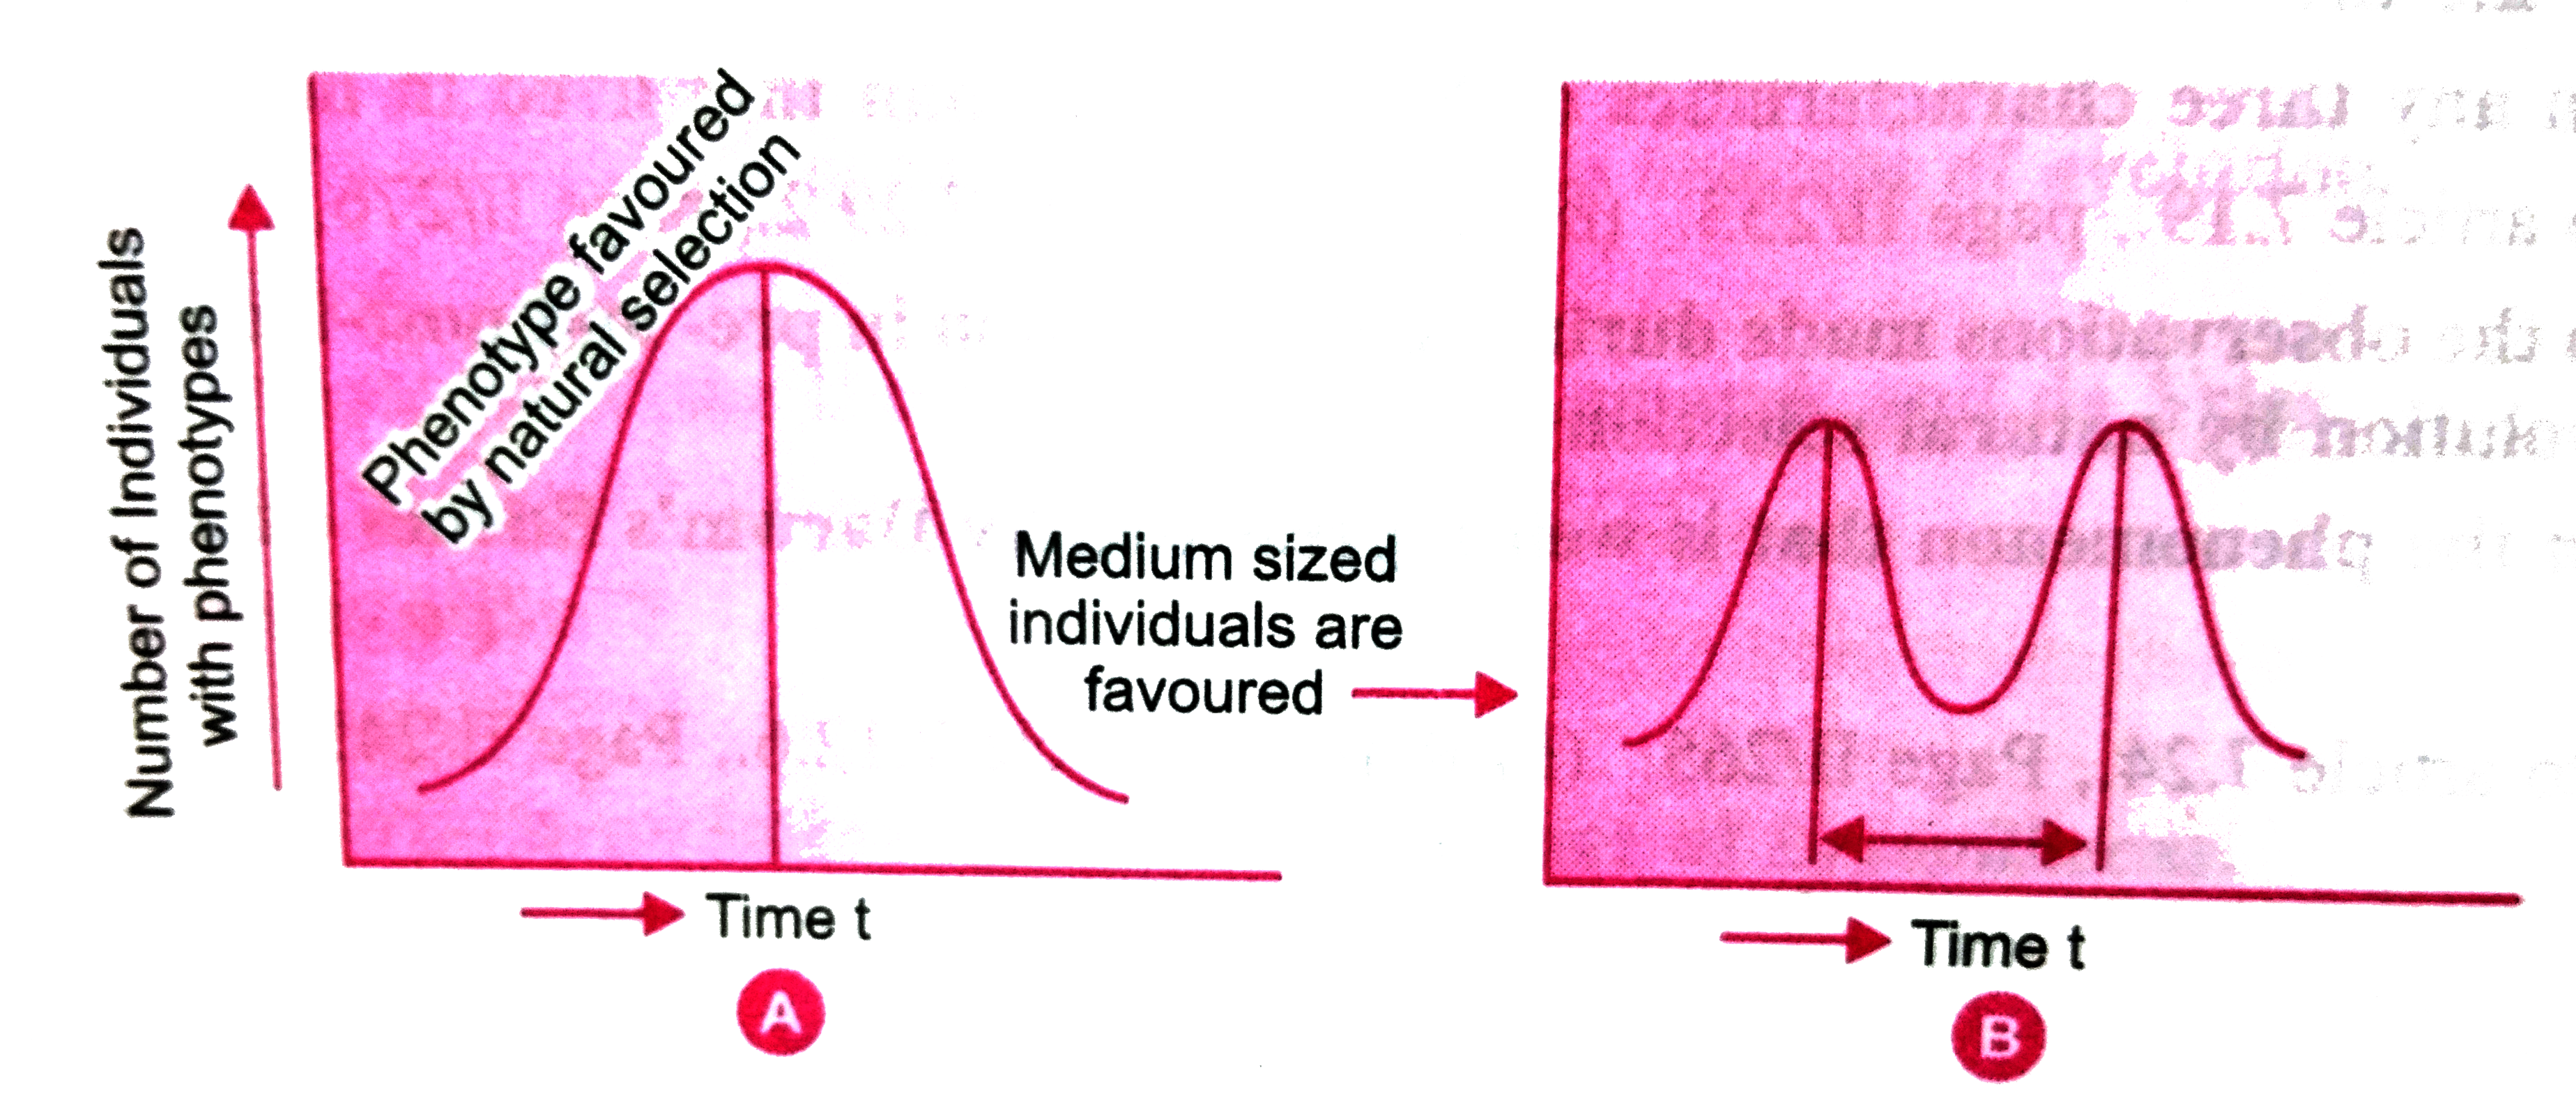
(i)Under the influence of which type of natural selection would graph (a) become like graph (b) ?
(ii)what could be the likely reasons of new variations arising in the population ?
(iii)Who suggested natural selection as a mechanism of evolution ?
(i)Disruptive selection
(ii)here, the extreme have more adaptable phenotypes than the average ones. Consequently , the original population is disrupted into two and more separate groups that latter evolve into new species .
(iii)Charles Darwin
Topper's Solved these Questions
- EVOLUTIONBOOK - PRADEEPCHAPTER - EVOLUTIONEXERCISE - Practice Question (Multiple Choice Question )
180 Videos
- EVOLUTIONBOOK - PRADEEPCHAPTER - EVOLUTIONEXERCISE - Practice Question (Assertion -Reason )
35 Videos
- EVOLUTIONBOOK - PRADEEPCHAPTER - EVOLUTIONEXERCISE - ADDITIONAL QUESTIONS (Long Answer Questions)
69 Videos
- ENVIRONMENTAL ISSUESBOOK - PRADEEPCHAPTER - ENVIRONMENTAL ISSUESEXERCISE - PRACTICE QUESTIONS (ASSERTION-REASON TYPE QUESTIONS)
7 Videos
- HUMAN HEALTH AND DISEASEBOOK - PRADEEPCHAPTER - HUMAN HEALTH AND DISEASEEXERCISE - Assetion-Reason Type Questions
20 Videos
Similar Questions
Study the following graph and answer the question given below :
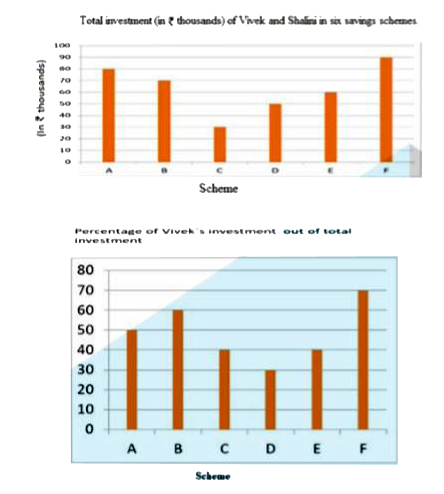
What is the average amount invested by Vivek in savings schemes A, B, C and D ?
View SolutionStudy the following bar graph and answer the questions given below.
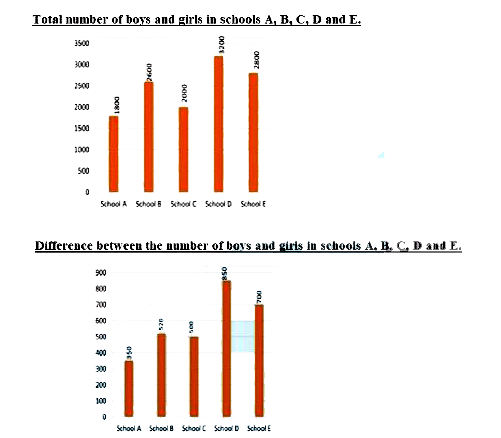
The number of boys in school B is what percentage of the total number of students in that school ?
View Solution
Knowledge Check
Study the following graph carefully and answer the questions given below
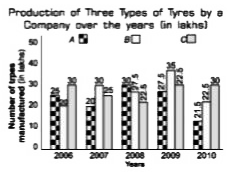
What was the difference between the number of B type tyres manufactured in 2008 and 2009?A100000B2000000C1000000Dnone to theseStudy the following graph carefully and answer the questions given below
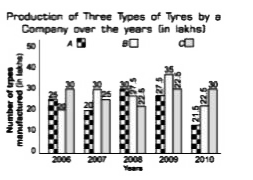
In which of the following years, was the percentage production of B type to C type the maximum?A2008B2009C2010D2007Study the following graph carefully and answer the given questions.
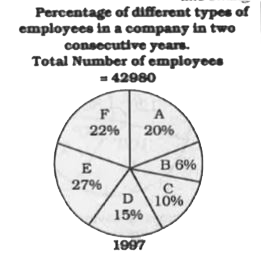
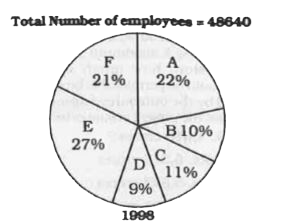
What was the approximate difference in the number of B type of employees during 1997 and 1998 ?A2285B2325C2620D2085
Study of following map and answer the questions given below:
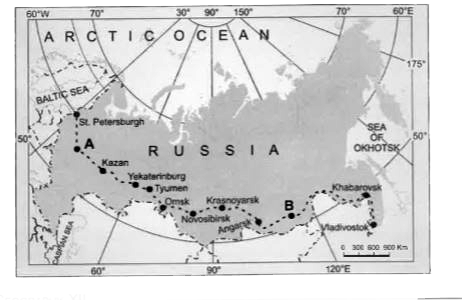
(i) Name the railway line shown in this map.
(ii) In which country does this railway line lie?
(iii) Name the station marked in the map as A and B.
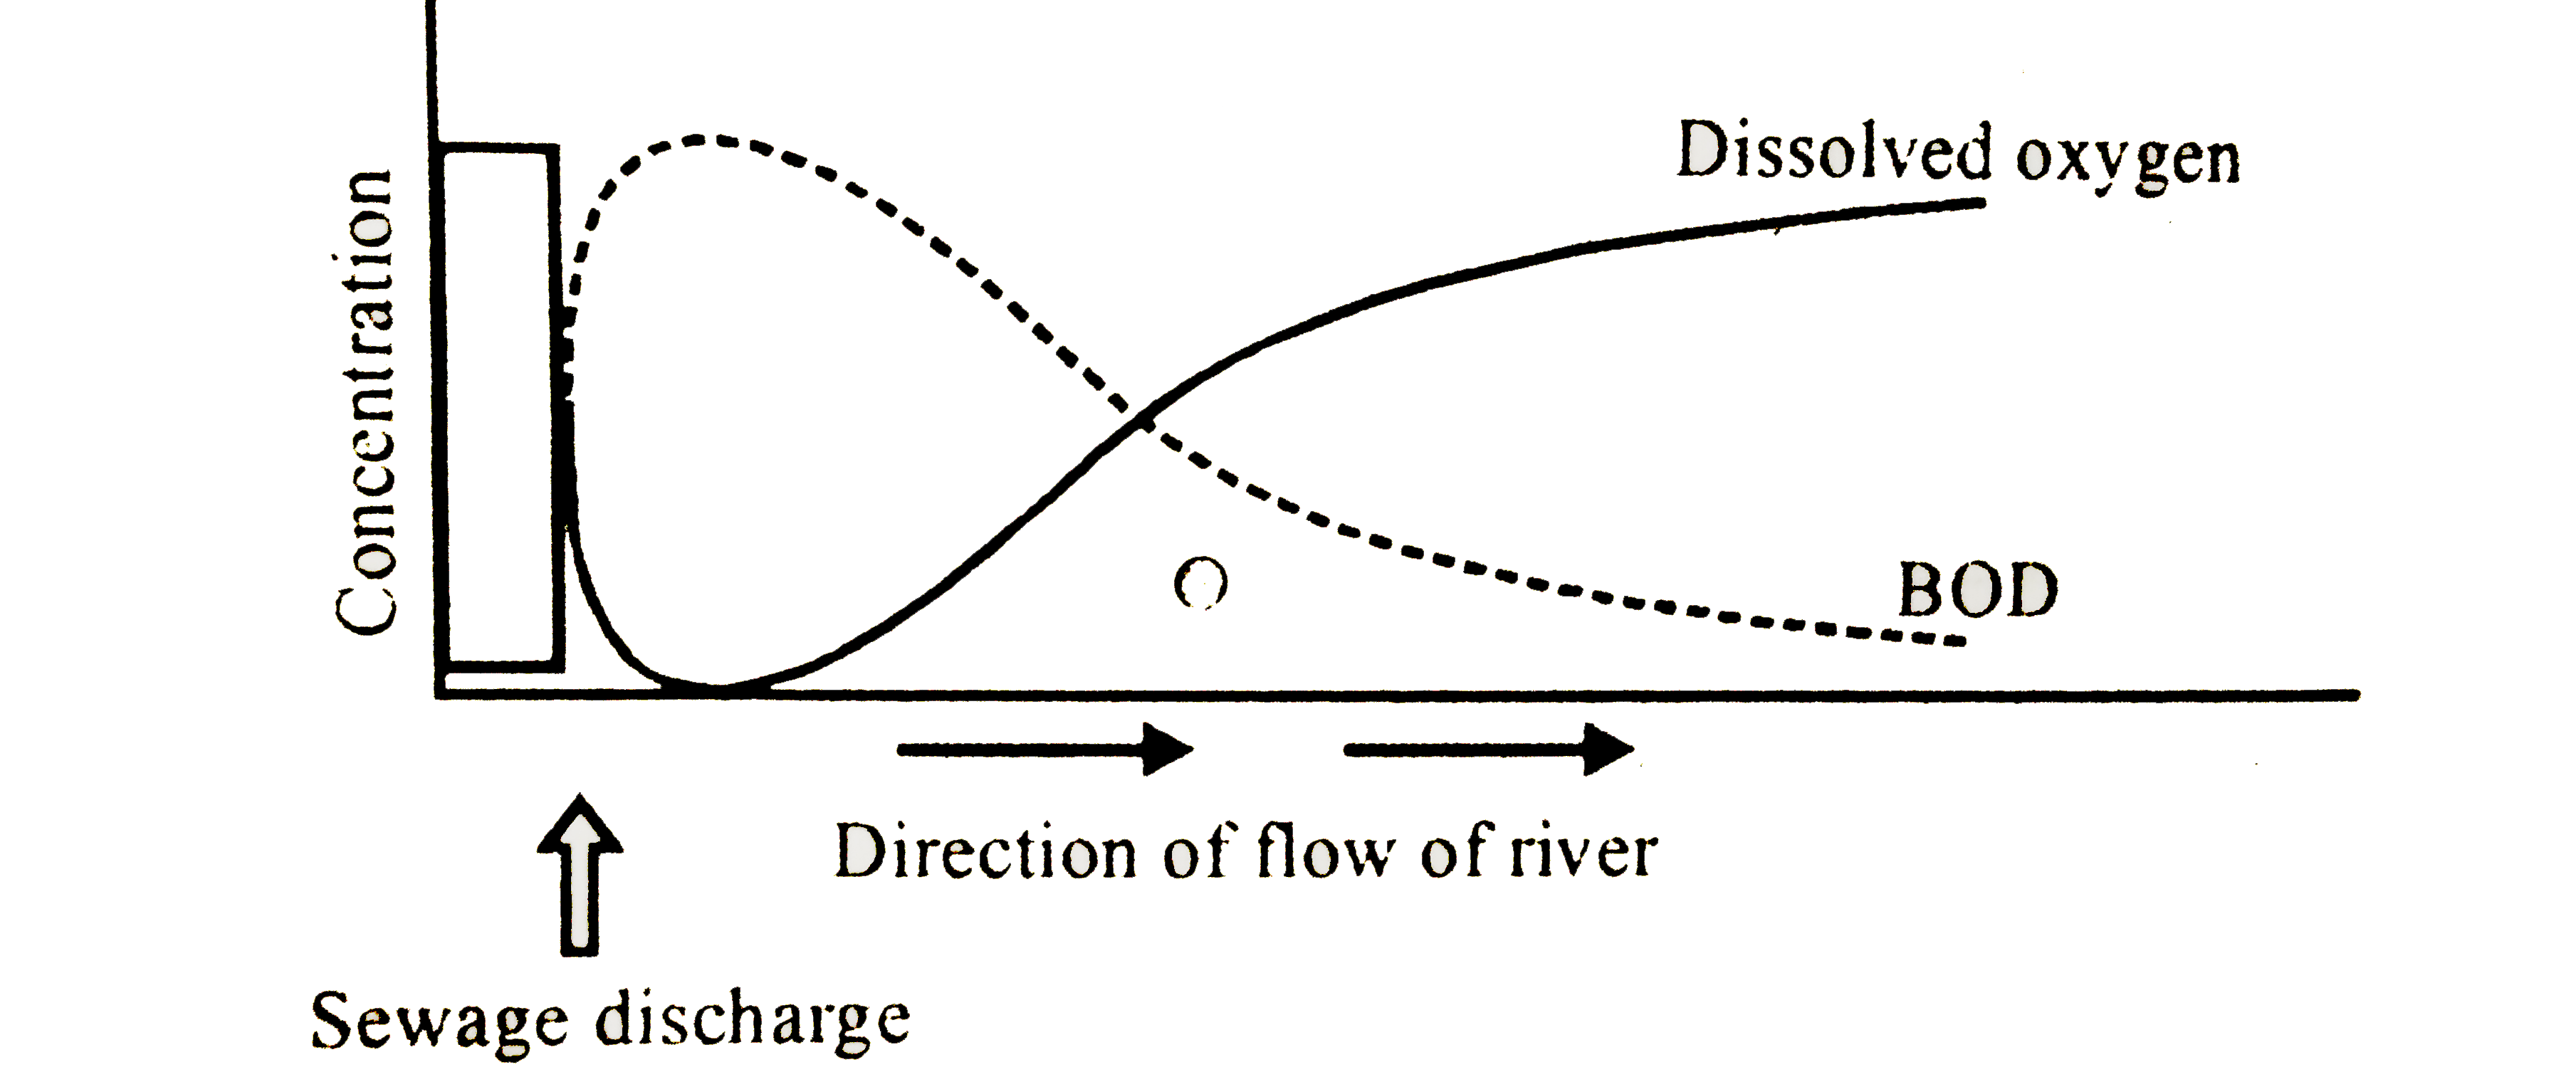
View SolutionStudy the graph given below and answer the question that follow ?
(i) What is relationship between dissolved oxygen and biochemical oxygen Demand (BOD) ?
(ii) Mention their effect on aquatic life in the river.
View SolutionThe following line graph shows the change in temperature of a block of ice when heated.
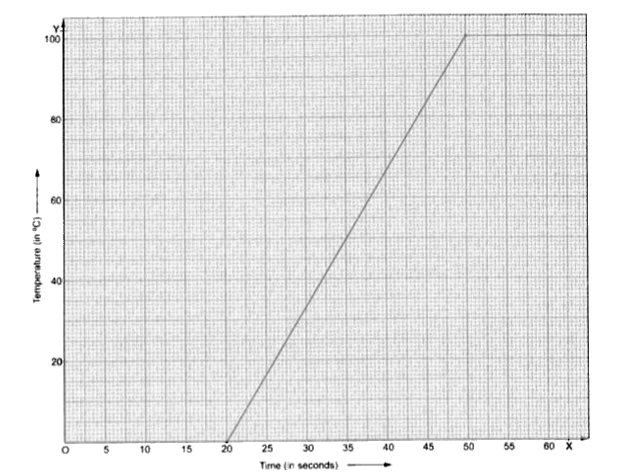
Study the above graph carefully and answer the questions given below :
(i) For how many seconds did the ice block have no change in temperature?
(ii) For how long was there a change in temperature?
(iii) After how many seconds of heating did the temperature become constant at 100∘C ?
(iv) What was the temperature after 25 seconds?
(v) What will be the temperature after 1.5 minutes ? Justify your answer.
View SolutionStudy the ray diagram given below and answer the following questions:
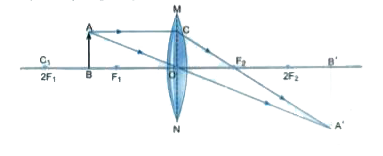
(i) State the type of lens used in the figure.
(ii) List two properties of the image formed .
(iii) In which position of the object will be magnification be -1 ?
View SolutionStudy the following graph carefully and answer the questions given below
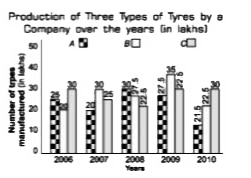
The total production of C type tyres in 2006 and 2007 together was what percentage of pro- duction of B type tyres in 2008?
View Solution
