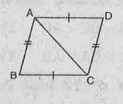
పటంలో ΔABC≅ΔCDA అగుటకు నియమం

Step by step video & image solution for పటంలో Delta ABC ~= Delta CDA అగుటకు నియమం by Maths experts to help you in doubts & scoring excellent marks in Class 9 exams.
Updated on:21/07/2023Topper's Solved these Questions
- త్రిభుజాలుBook:VGS PUBLICATION-BRILLIANT(TELUGU)Chapter:త్రిభుజాలుExercise:Exercise
Explore 89 Videos
- జ్యామితీయ మూలాలుBook:VGS PUBLICATION-BRILLIANT(TELUGU)Chapter:జ్యామితీయ మూలాలుExercise:Exercise
Explore 47 Videos
- నిరూపక జ్యామితిBook:VGS PUBLICATION-BRILLIANT(TELUGU)Chapter:నిరూపక జ్యామితిExercise:Exercise
Explore 87 Videos
Similar Questions
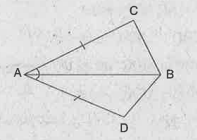
చతుర్భుజం ABCD లో , AC=AD మరియి ∠A కు AB కోన సమద్విఖండన రేఖ అయిన ΔABC=ΔABD అని చూపండి. BC మరియు BD ల గురించి మీరు ఏమి చెప్పగలరు?

View Solutionకింది వానికి జవాబులు ఇవ్వండి. ఘనాలకు ఎన్ని కొలతలు ఉంటాయి?
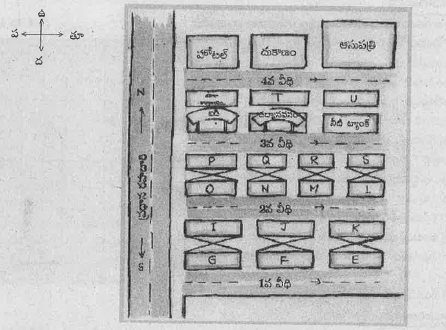
View Solutionఒక ఆవాస ప్రాంతంలో ప్రధాన రహదారి ఉత్తర-దక్షిణ దిశలలో ఉంది. దాని పటం కింది ఇవ్వబడినది. పటం సహాయంతో కింది ప్రశ్నలకు సమాధానాలు వ్రాయండి.
 తూర్పుదిక్కున వెళ్లునప్పుడు మూడవవీధిలో ఎడమవైపు మూడోవస్థానంలో ఏం ఉంది?
View SolutionHow many lines of symmetry does the above figure have ?
View SolutionWhich of the following are correct chain isomers of butane ? (i)
View SolutionDetermine the point of symmetry of a regular hexagon.
View SolutionDtermine the images of the following figure about the given line :
View SolutionIn the following figure, AB and BC are equidistant from the centre 'O' of the Show that
(a) ABC is an isosceles triangle.
(b) OB bisects angle ABC.
ltimg src="https://d10lpgp6xz60nq.cloudfront.net/physics_images/PS_MATH_X_C13_E02_006_Q01.png" width="80%"gt
View SolutionMatch the following Column A to Column B

View SolutionMatch the following Column A to Column B

View SolutionMatch the following Column A to Column B

View SolutionFind the area of the figure given below.

View SolutionThe area of the shaded part in the figure given below is ______.

View SolutionThe inequation represented by the graph given below is :
View SolutionThe inequation that best describes the graph given below is _________
View SolutionThe inequation that best describes the following graph is _________
View Solution