Study the following graph carefully and answer the given questions.
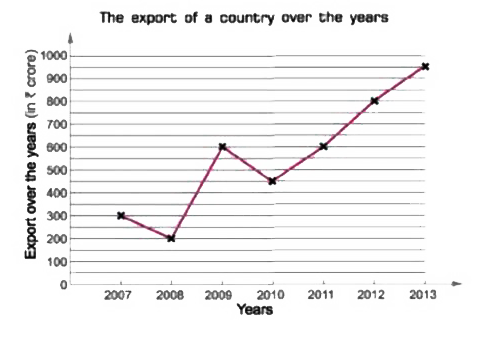
Which year has the highest per cent increase/decrease in exports as compared to the preceding year ?
Step by step video & image solution for Study the following graph carefully and answer the given questions. Which year has the highest per cent increase/decrease in exports as compared to the preceding year ? by Maths experts to help you in doubts & scoring excellent marks in Class 14 exams.
Updated on:21/07/2023Topper's Solved these Questions
- LINE GRAPHBOOK - ARIHANT SSCCHAPTER - LINE GRAPHEXERCISE - FAST TRACK PRACTICE
43 Videos
- INDICES AND SURDSBOOK - ARIHANT SSCCHAPTER - INDICES AND SURDSEXERCISE - HIGHER SKILL LEVEL QUESTIONS
17 Videos
- LINEAR EQUATIONSBOOK - ARIHANT SSCCHAPTER - LINEAR EQUATIONSEXERCISE - Higher Skill Level Questions
7 Videos
Similar Questions
Study the following graph carefully and answer the given questions.
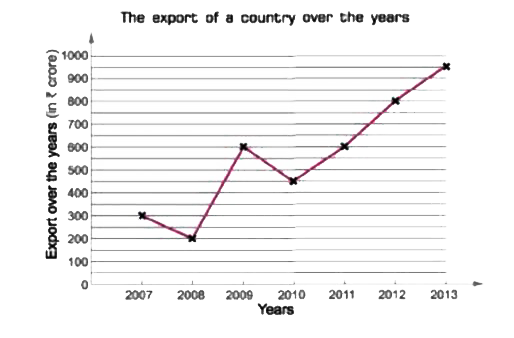
What is the percentage increase in exports from the lowest to the highest for the given years ?
View SolutionStudy the following graph carefully and answer the given questions.
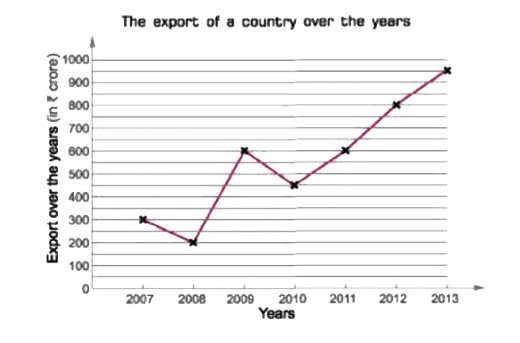
What is the total exports ( in ? Crore) for the given years ?
View Solution
Knowledge Check
Study the following graph carefully and answer the following questions -----
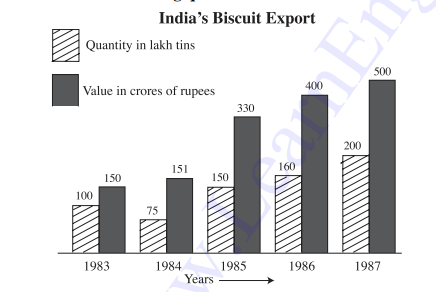
What was the approximate per cent increase in export value from 1983 to 1987 ?A350B330C43D233Study the following graph carefully and answer the following questions -----
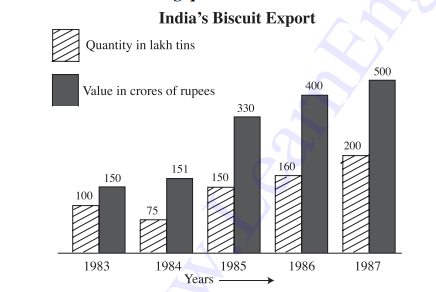
In which year the value per tins was minimum ?A1983B1984C1985D1986Study the following graph carefully and answer the questions that
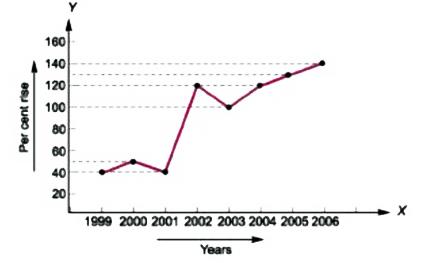
What was the average of percent rise over the given years ?A1.1B1.05C100.5%D92.5%
Study the following graph carefully and answer the given questions.
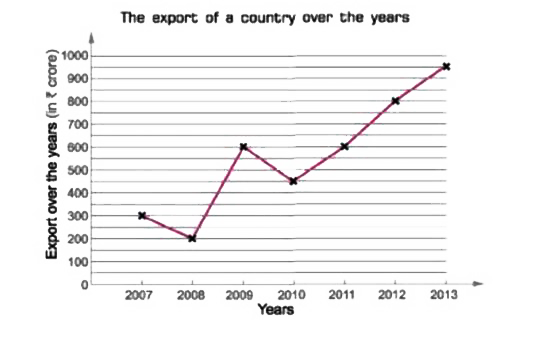
What is the difference in exports in the years 2009 and 2010 ?
View SolutionStudy the following graph carefully and answer the questions given below it -----
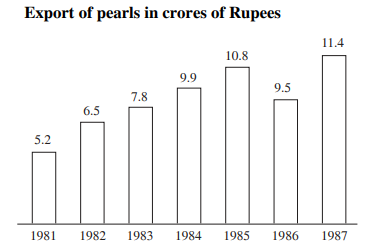
What was the percentage increase in export from 1986 to 1987 ?
View SolutionStudy the following graph carefully and answer the questions given below it -----
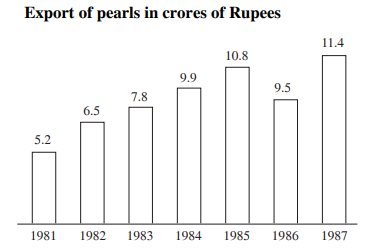
In which year there was maximum percentage increase in export of pearls to that in the previous year ?
View SolutionStudy the following bar graph and answer the question that follows.
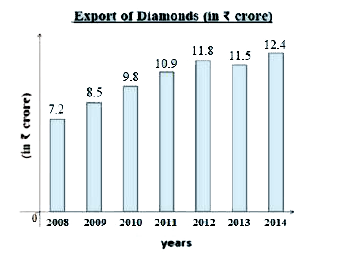
In which year was the maximum percentage increase in diamond exports compared to the previous year?
View SolutionStudy the following table carefully to answer these questions.
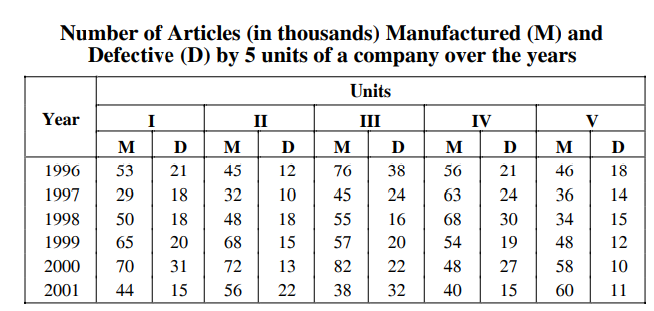
During which year was the percentage increase/decrease in manufacture from the previous year the highest for unit?
View Solution
