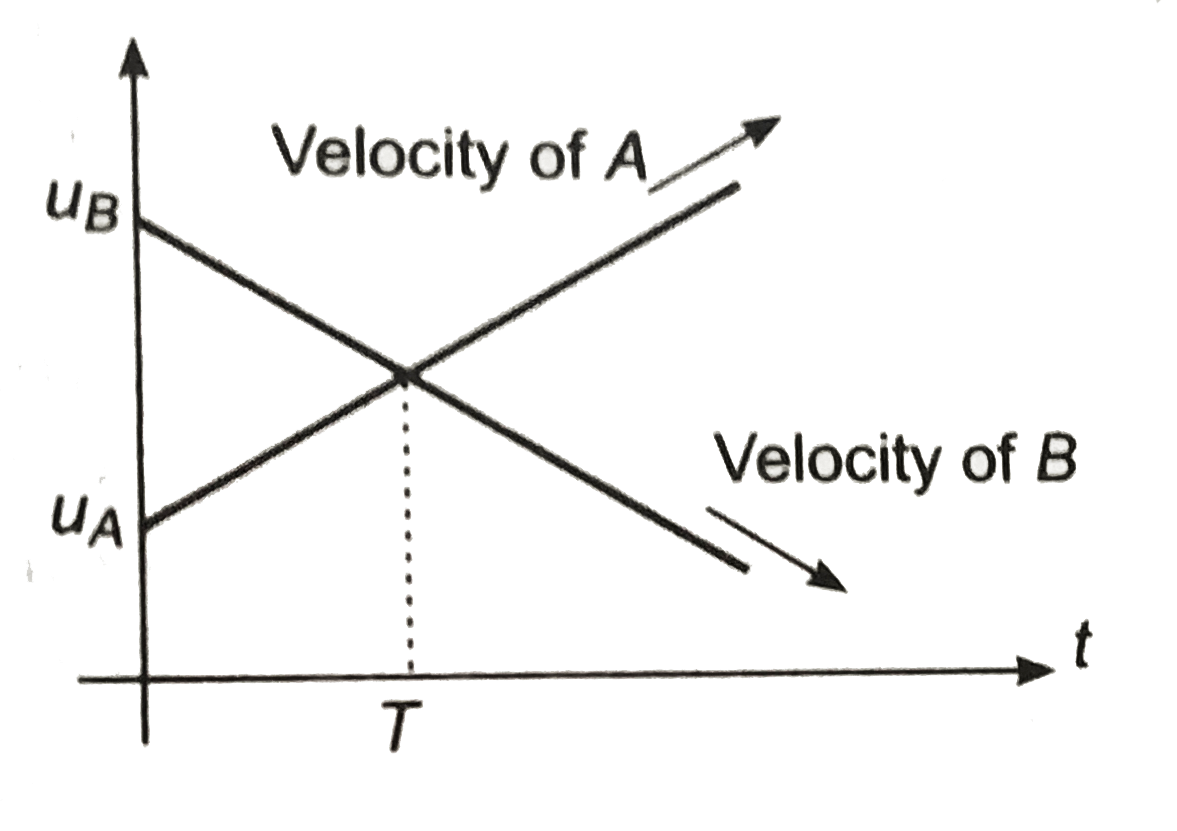
Two cars A and B start from a same point at same instant of time and move in same direction. The variation of their respective velocities with time is indicated in the graph as shown in the figure. The time after their motion starts, when the cars cross each other is?
Step by step video & image solution for Two cars A and B start from a same point at same instant of time and move in same direction. The variation of their respective velocities with time is indicated in the graph as shown in the figure. The time after their motion starts, when the cars cross each other is? by Physics experts to help you in doubts & scoring excellent marks in Class 11 exams.
Similar Questions
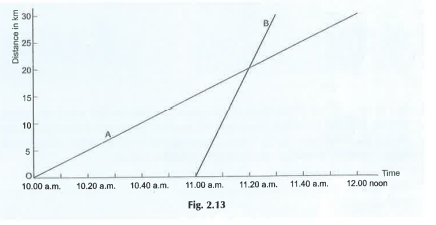
Two friends A and B started from the same location and went 30 km along a road in the same direction. Figure 2.13 shows their motions through graphs. Answer. The following question.When did B start ?
 View Solution
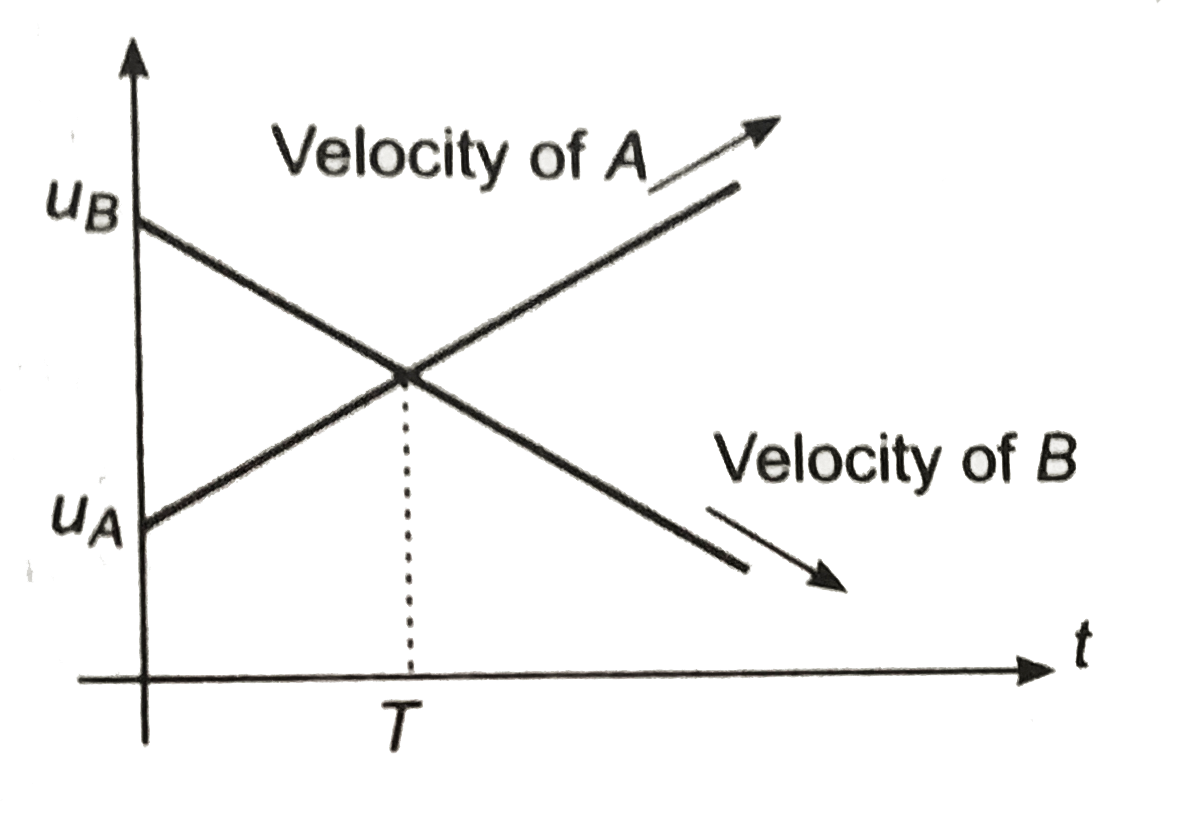
A situation is shown in which two objects A and B start their motion from same point in same direction. The graph of their velocities against time is drawn. uAanduB are the initial velocities of A and B respectively. T is the time at which their velocities become equal after start of motion. You cannot use the data of one question while solving another question of the same set. So all the questions are independent of each other.
7. After 10 s of the start of motion of both objects A and B, find the value of velocity of A if uA=6ms−1,uB=12ms−1 and at T velocity of A is 8ms−1andT=4s
 View Solution
Knowledge Check
- Question 1 - Select One
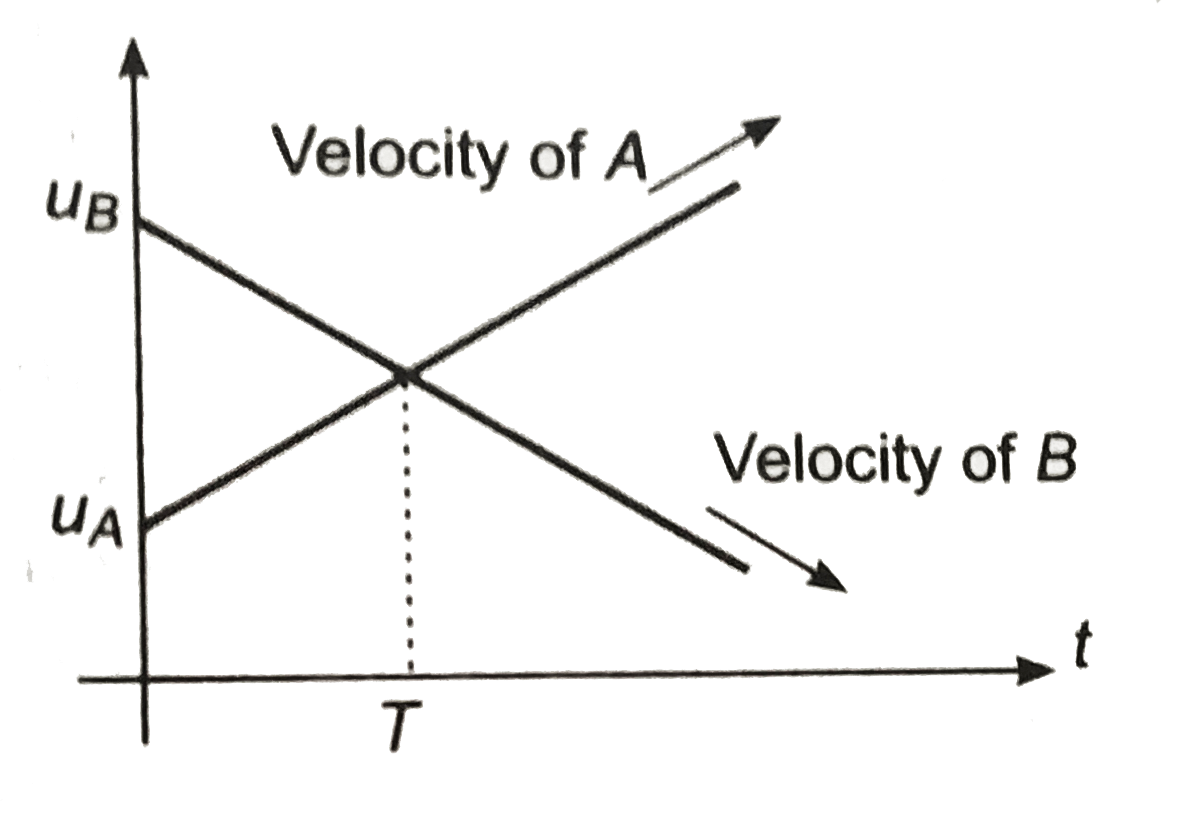
A situation is shown in which two objects A and B start their motion from same point in same direction. The graph of their velocities against time is drawn. uAanduB are the initial velocities of A and B respectively. T is the time at which their velocities become equal after start of motion. You cannot use the data of one question while solving another question of the same set. So all the questions are independent of each other.
6. Let vAandvB be the velocities of the particles A and B respectively at the moment A and B meet after start of the motion. If uA=5ms−1anduB=15ms−1, then the magnitude of the difference of velocities vAandvB is
 A5ms−1B10ms−1C15ms−1Ddata insufficient
 - Question 2 - Select One
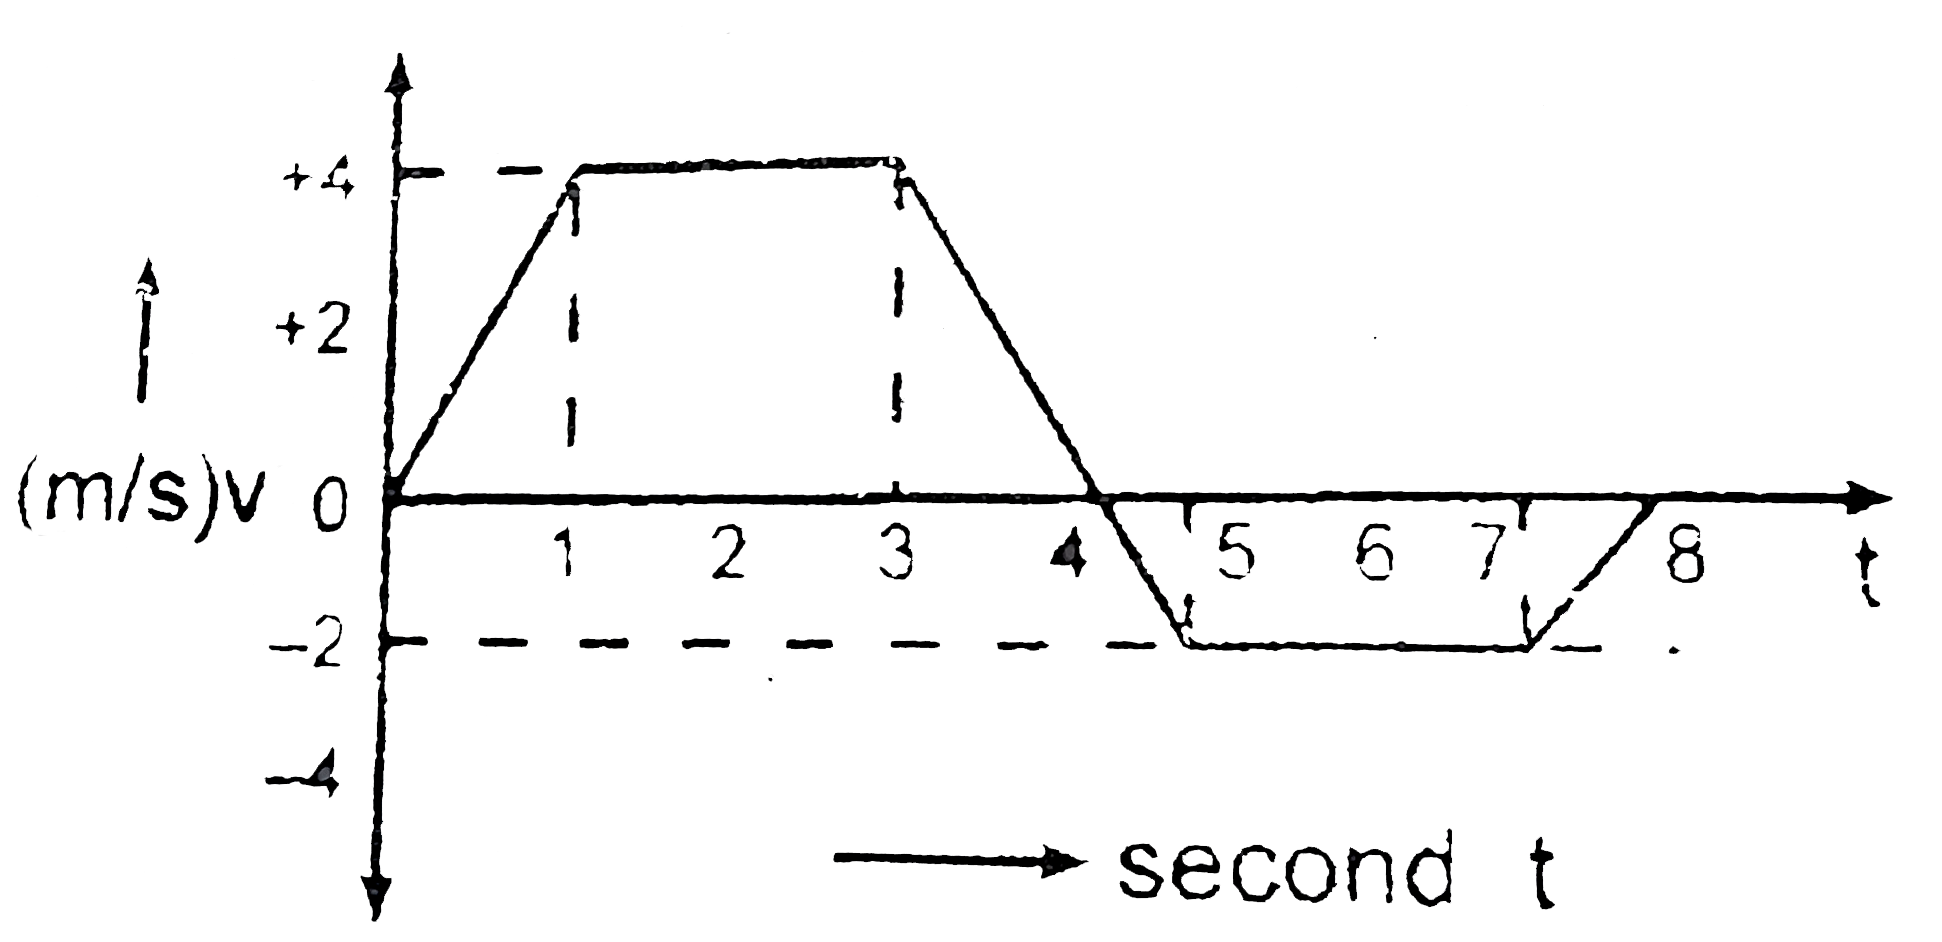
The velocity time graph of a linear motion is shown in the figure. The distance from the starting point after 8 seconds will be
 .A18 mB6 mC8 mDnone of these
 - Question 3 - Select One
A situation is shown in which two objects A and B start their motion from same point in same direction. The graph of their velocities against time is drawn. uAanduB are the initial velocities of A and B respectively. T is the time at which their velocities become equal after start of motion. If the value of T is 4 s, then the time after which A will meet B is
 A12 sB6 sC8 sDdata insufficient
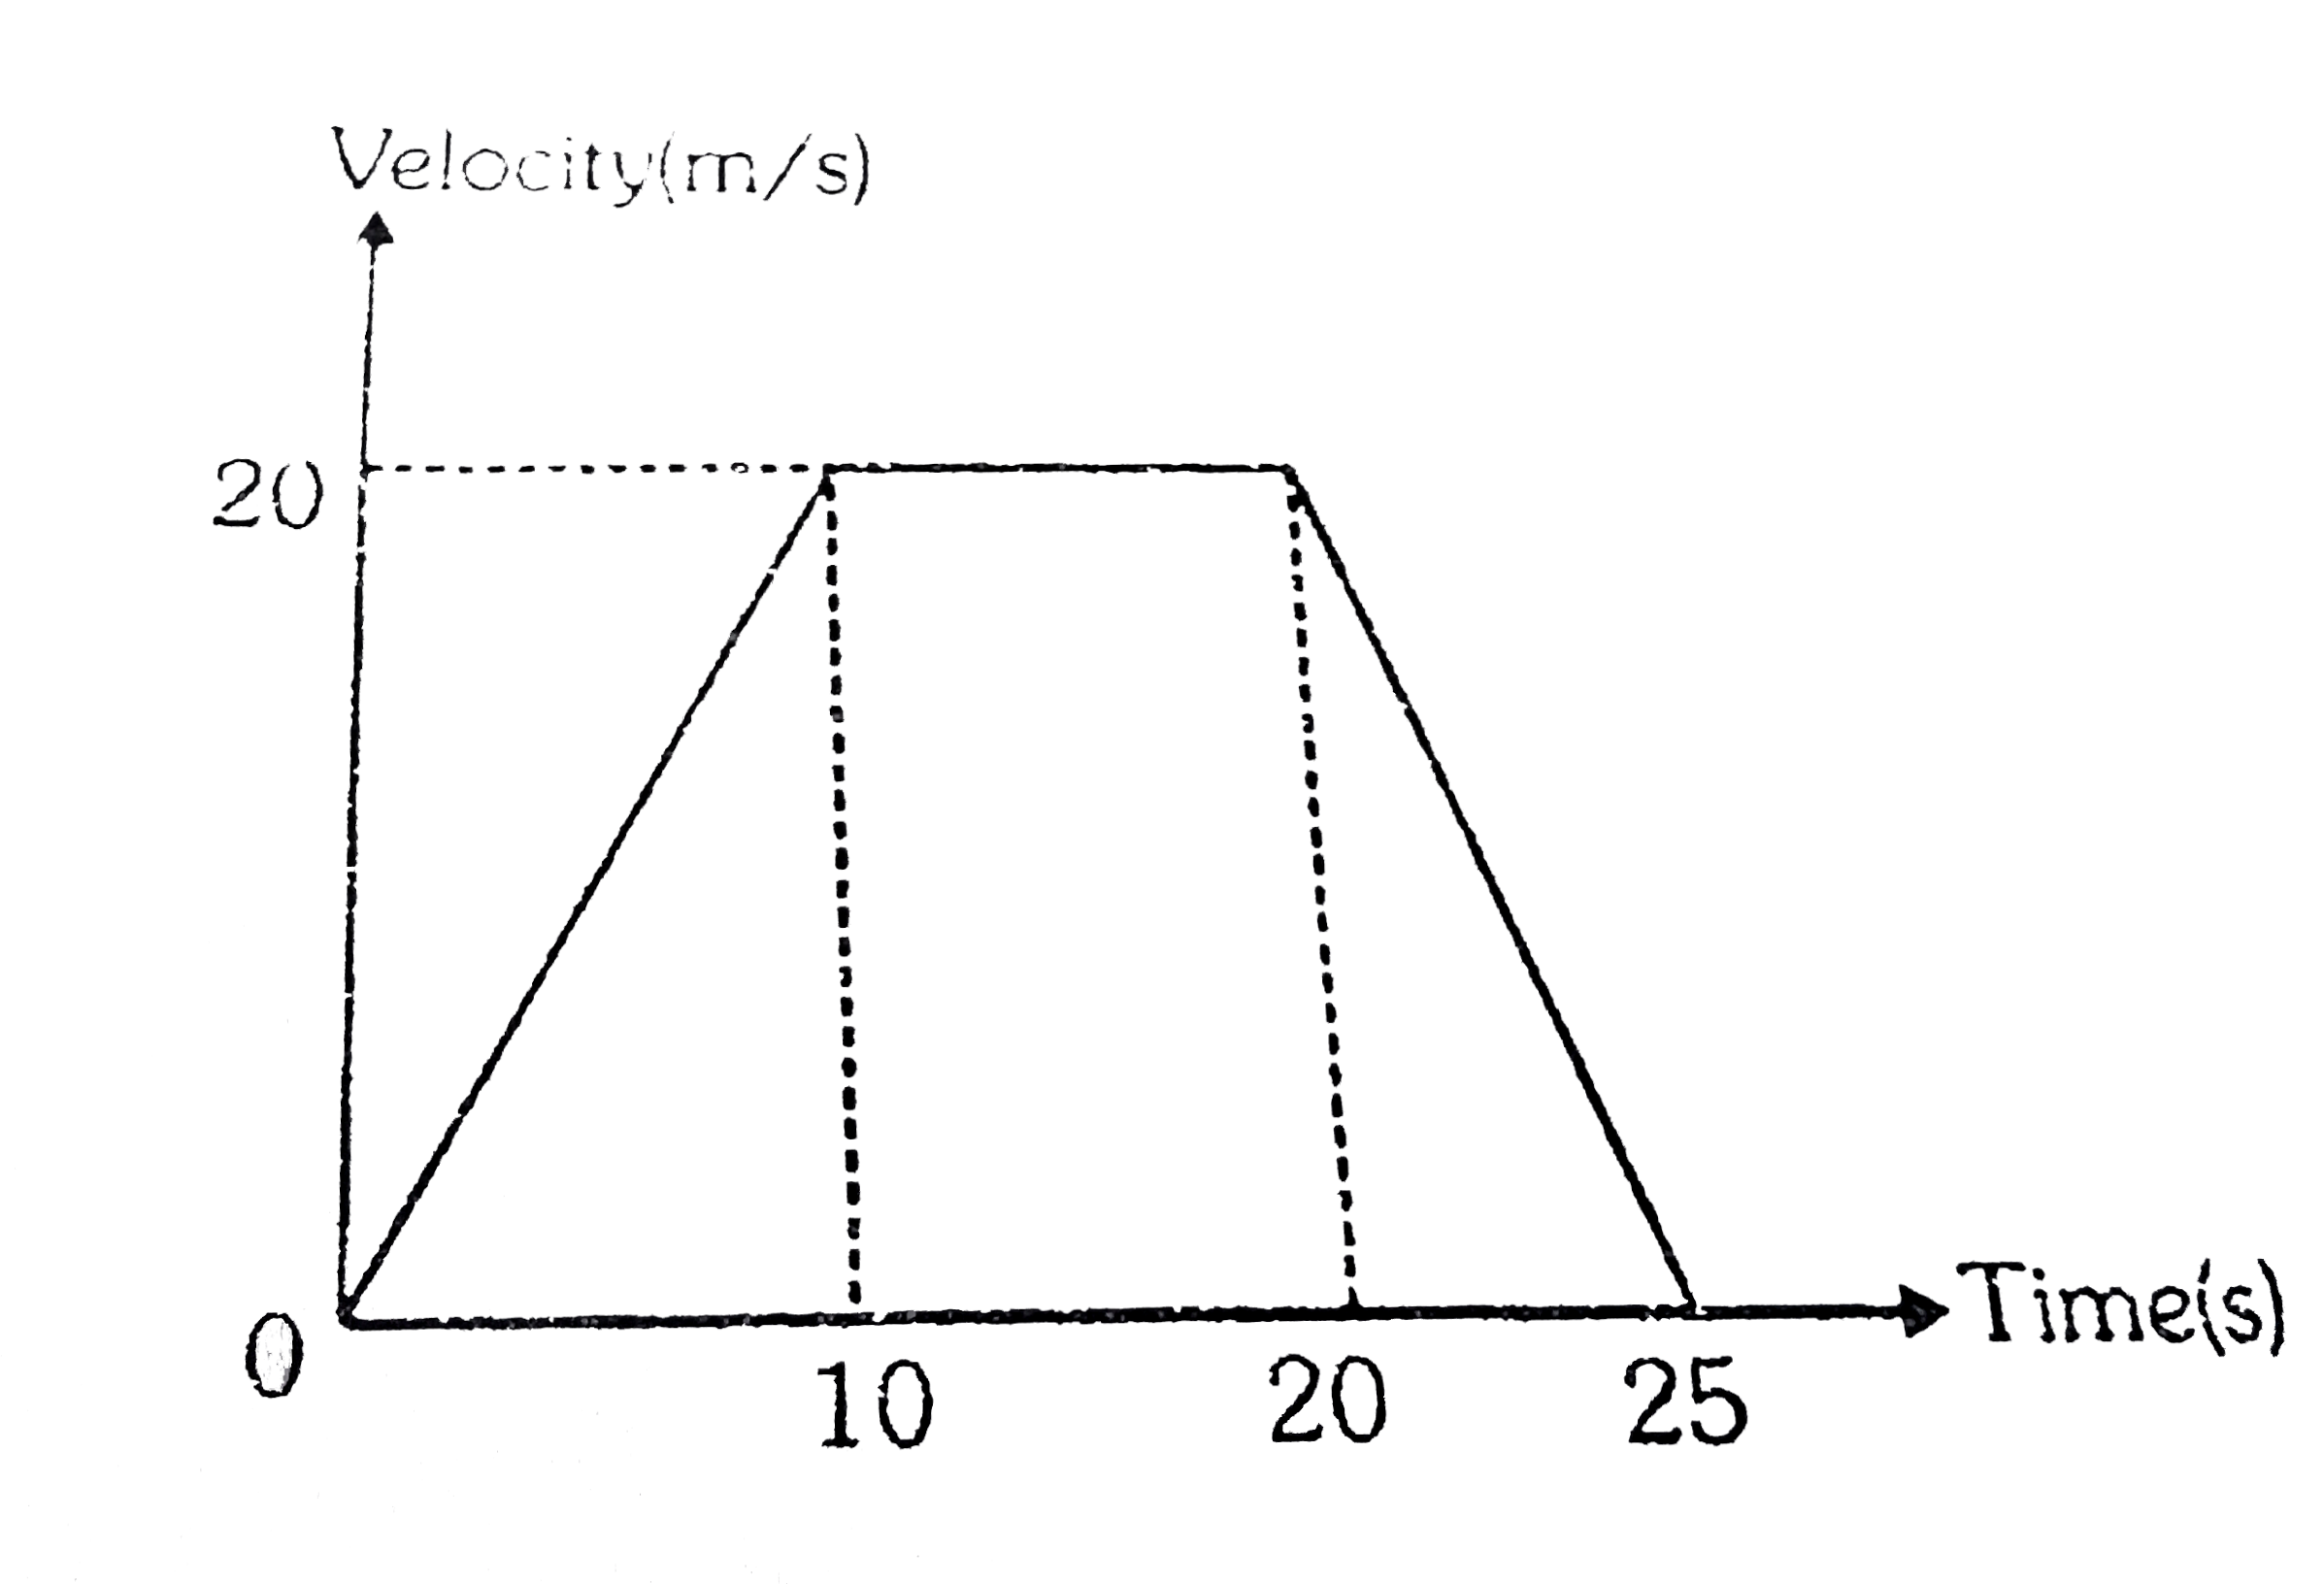
The velocity-time graph of a car moving along a straight road is shown in figure. The average velocity of the car is first 25 seconds is
 View Solution
Two cars are moving is one a same line dimension in opposite direction with the same speed v. The relative velocity of two cars w.r.t. each other is
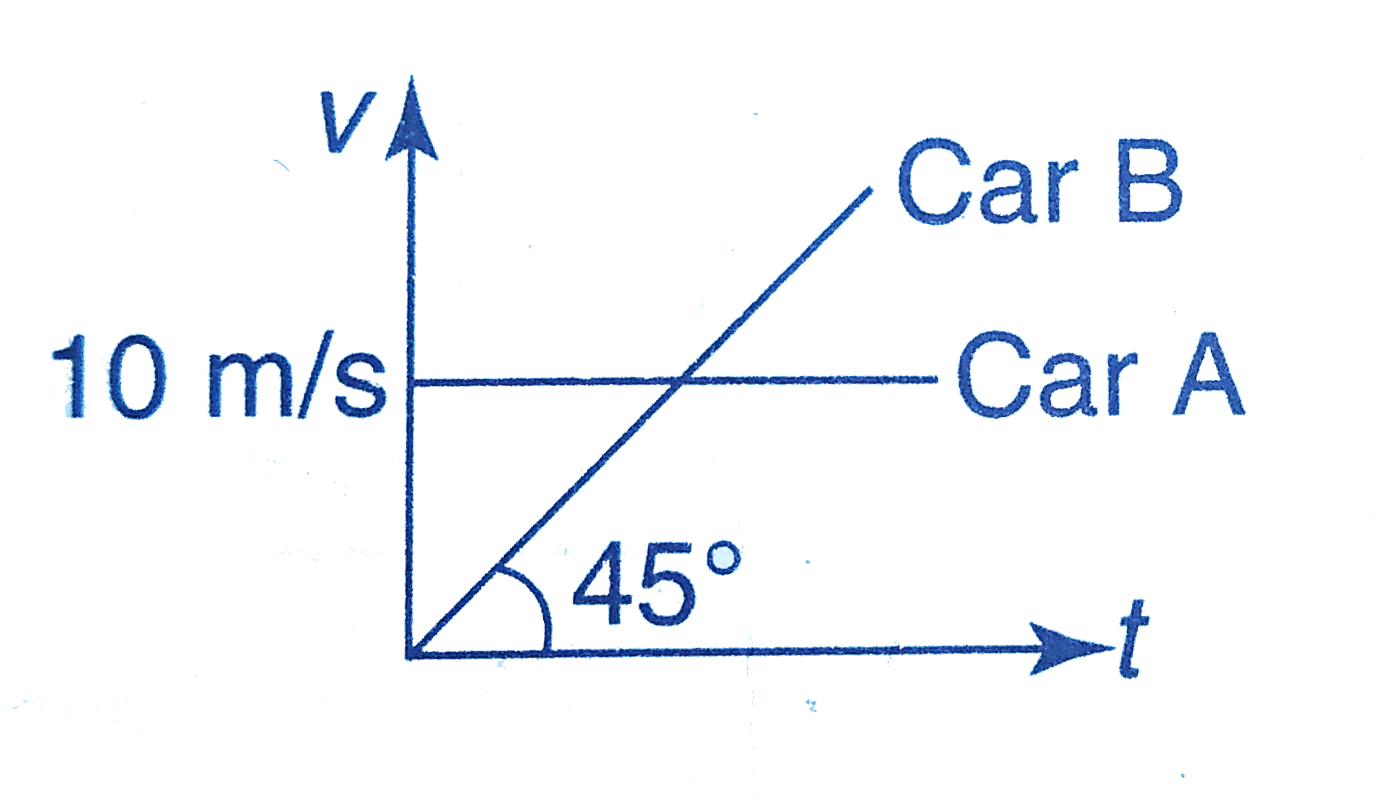
View SolutionInitially car A is 10.5m ahead of car B. Both start moving at time t=0 in the same direction along a straight line. The velocity-time graph of two cars is shown in figure. The time when the car B will catch the car A, will be.
 View Solution
Two cars A and B start moving from the same point with same velocity v=5km/minute. Car A moves towards North and car B in moving towards East. What is the relative velocity of B with respect to A ?
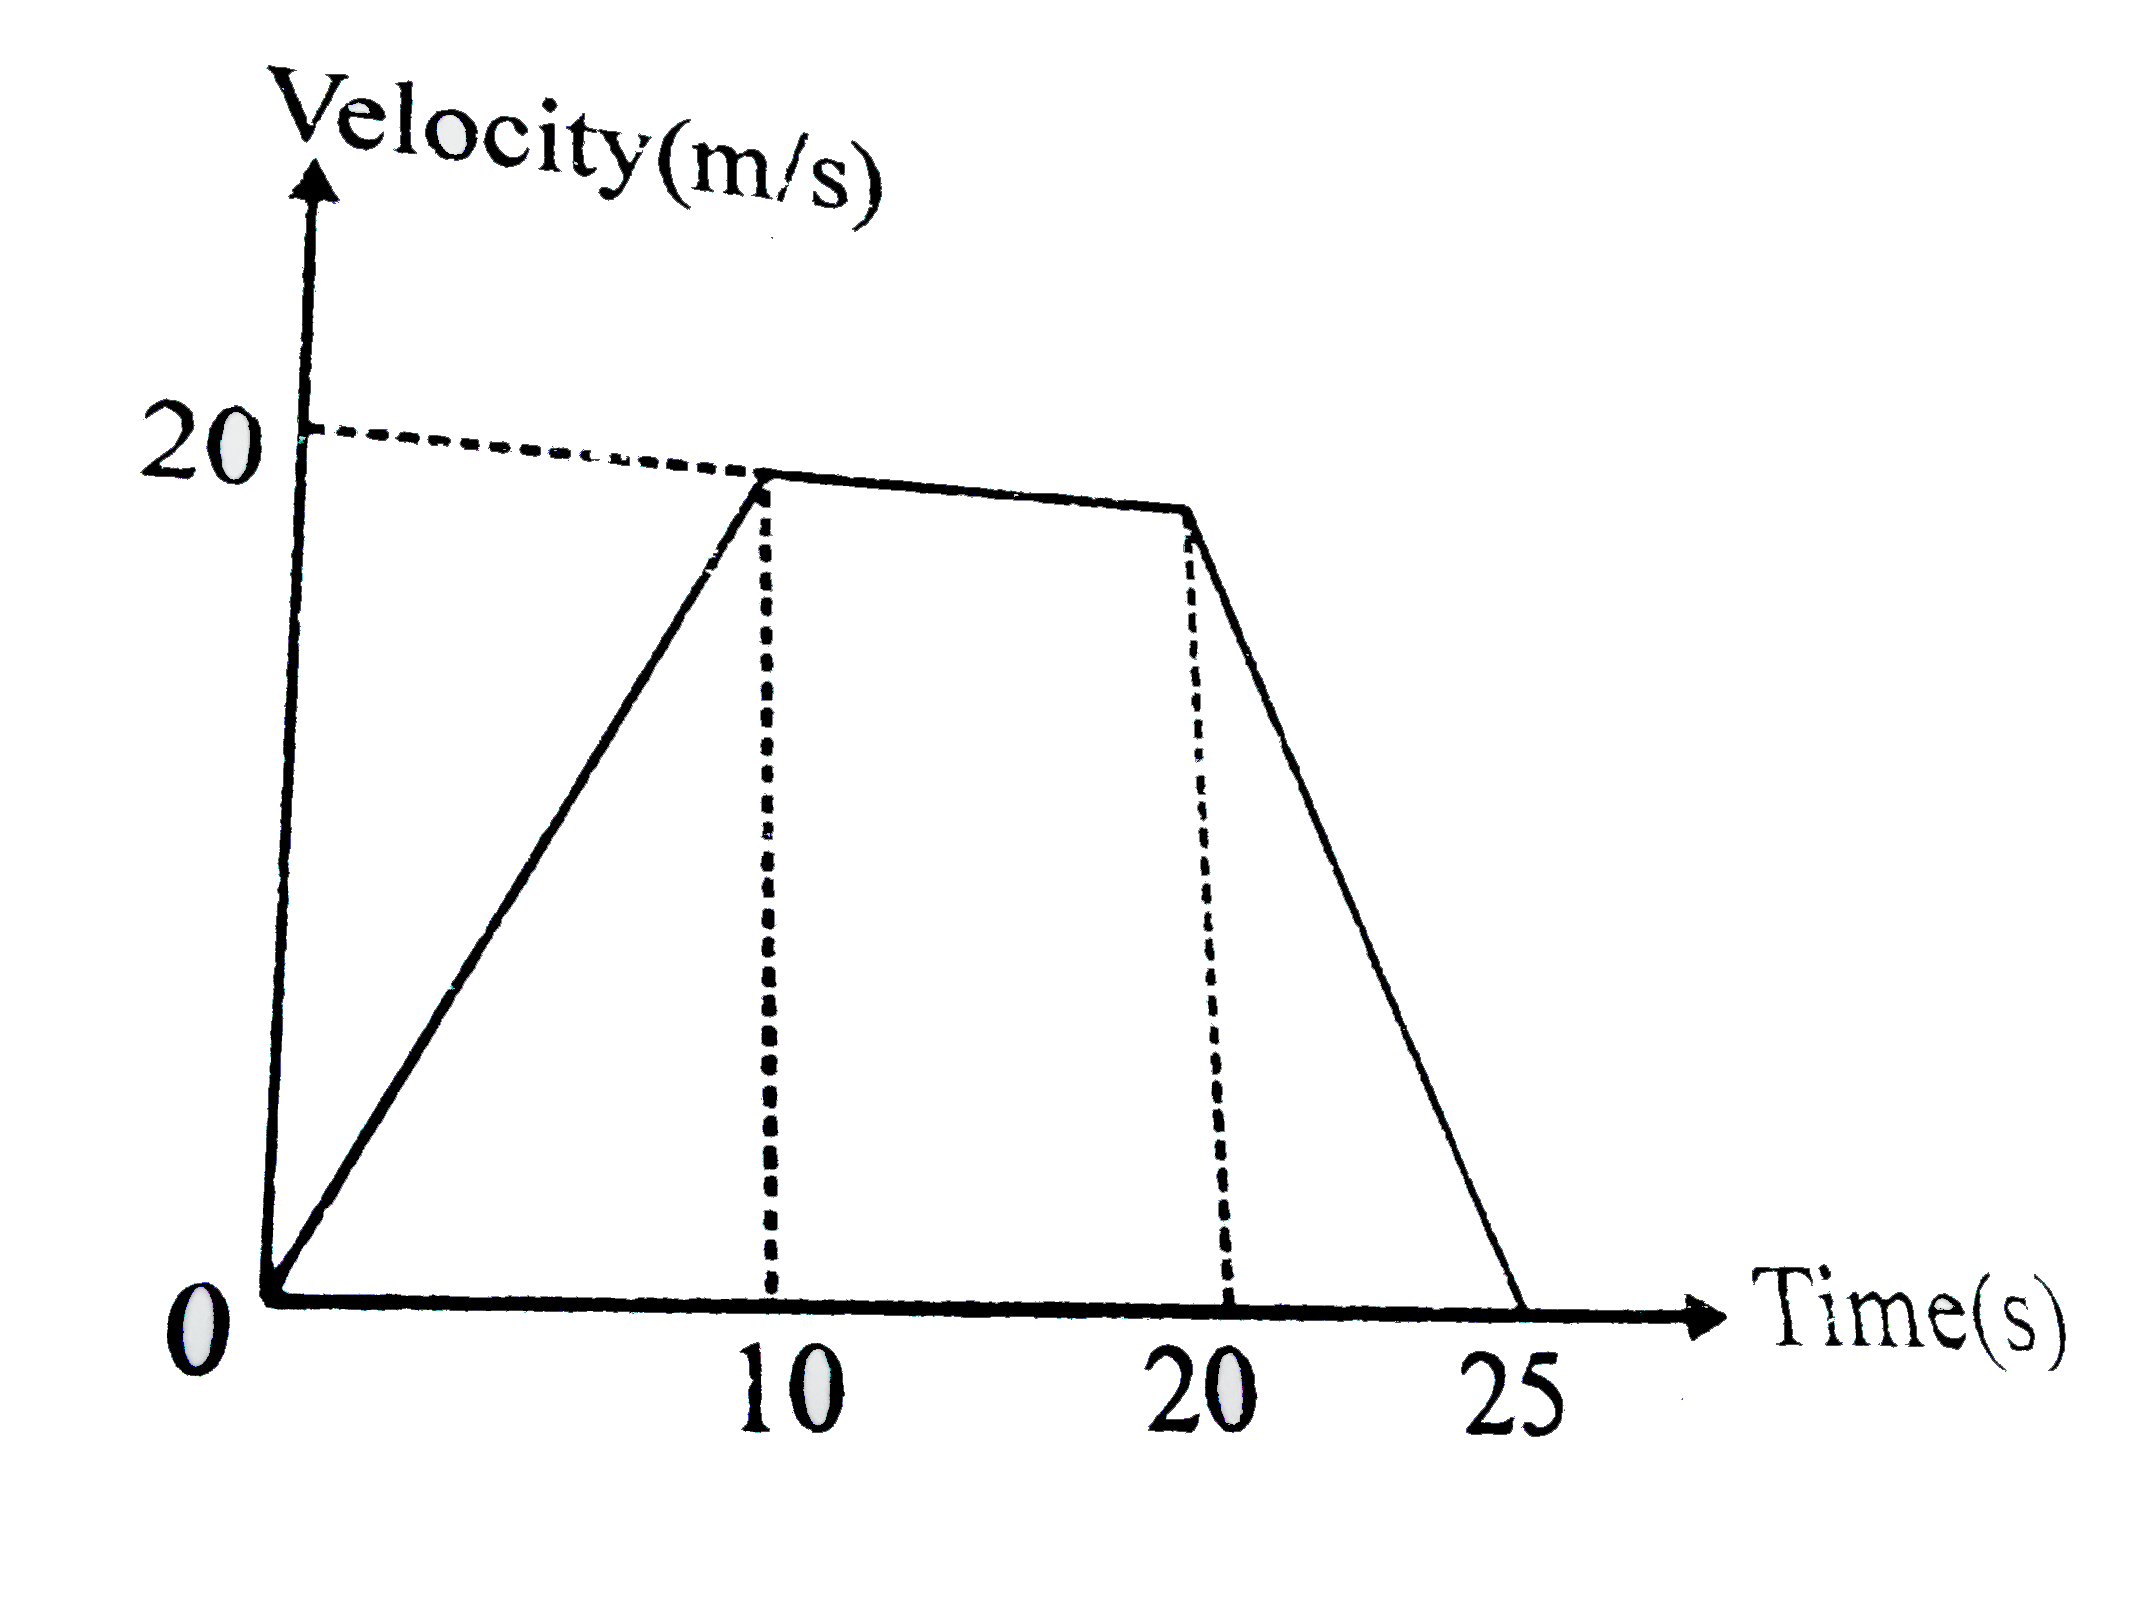
View SolutionThe velocity-time graph of a car moving along a straight road is shown in figure. The average velocity of the car in first 25 seconds is
 View Solution
