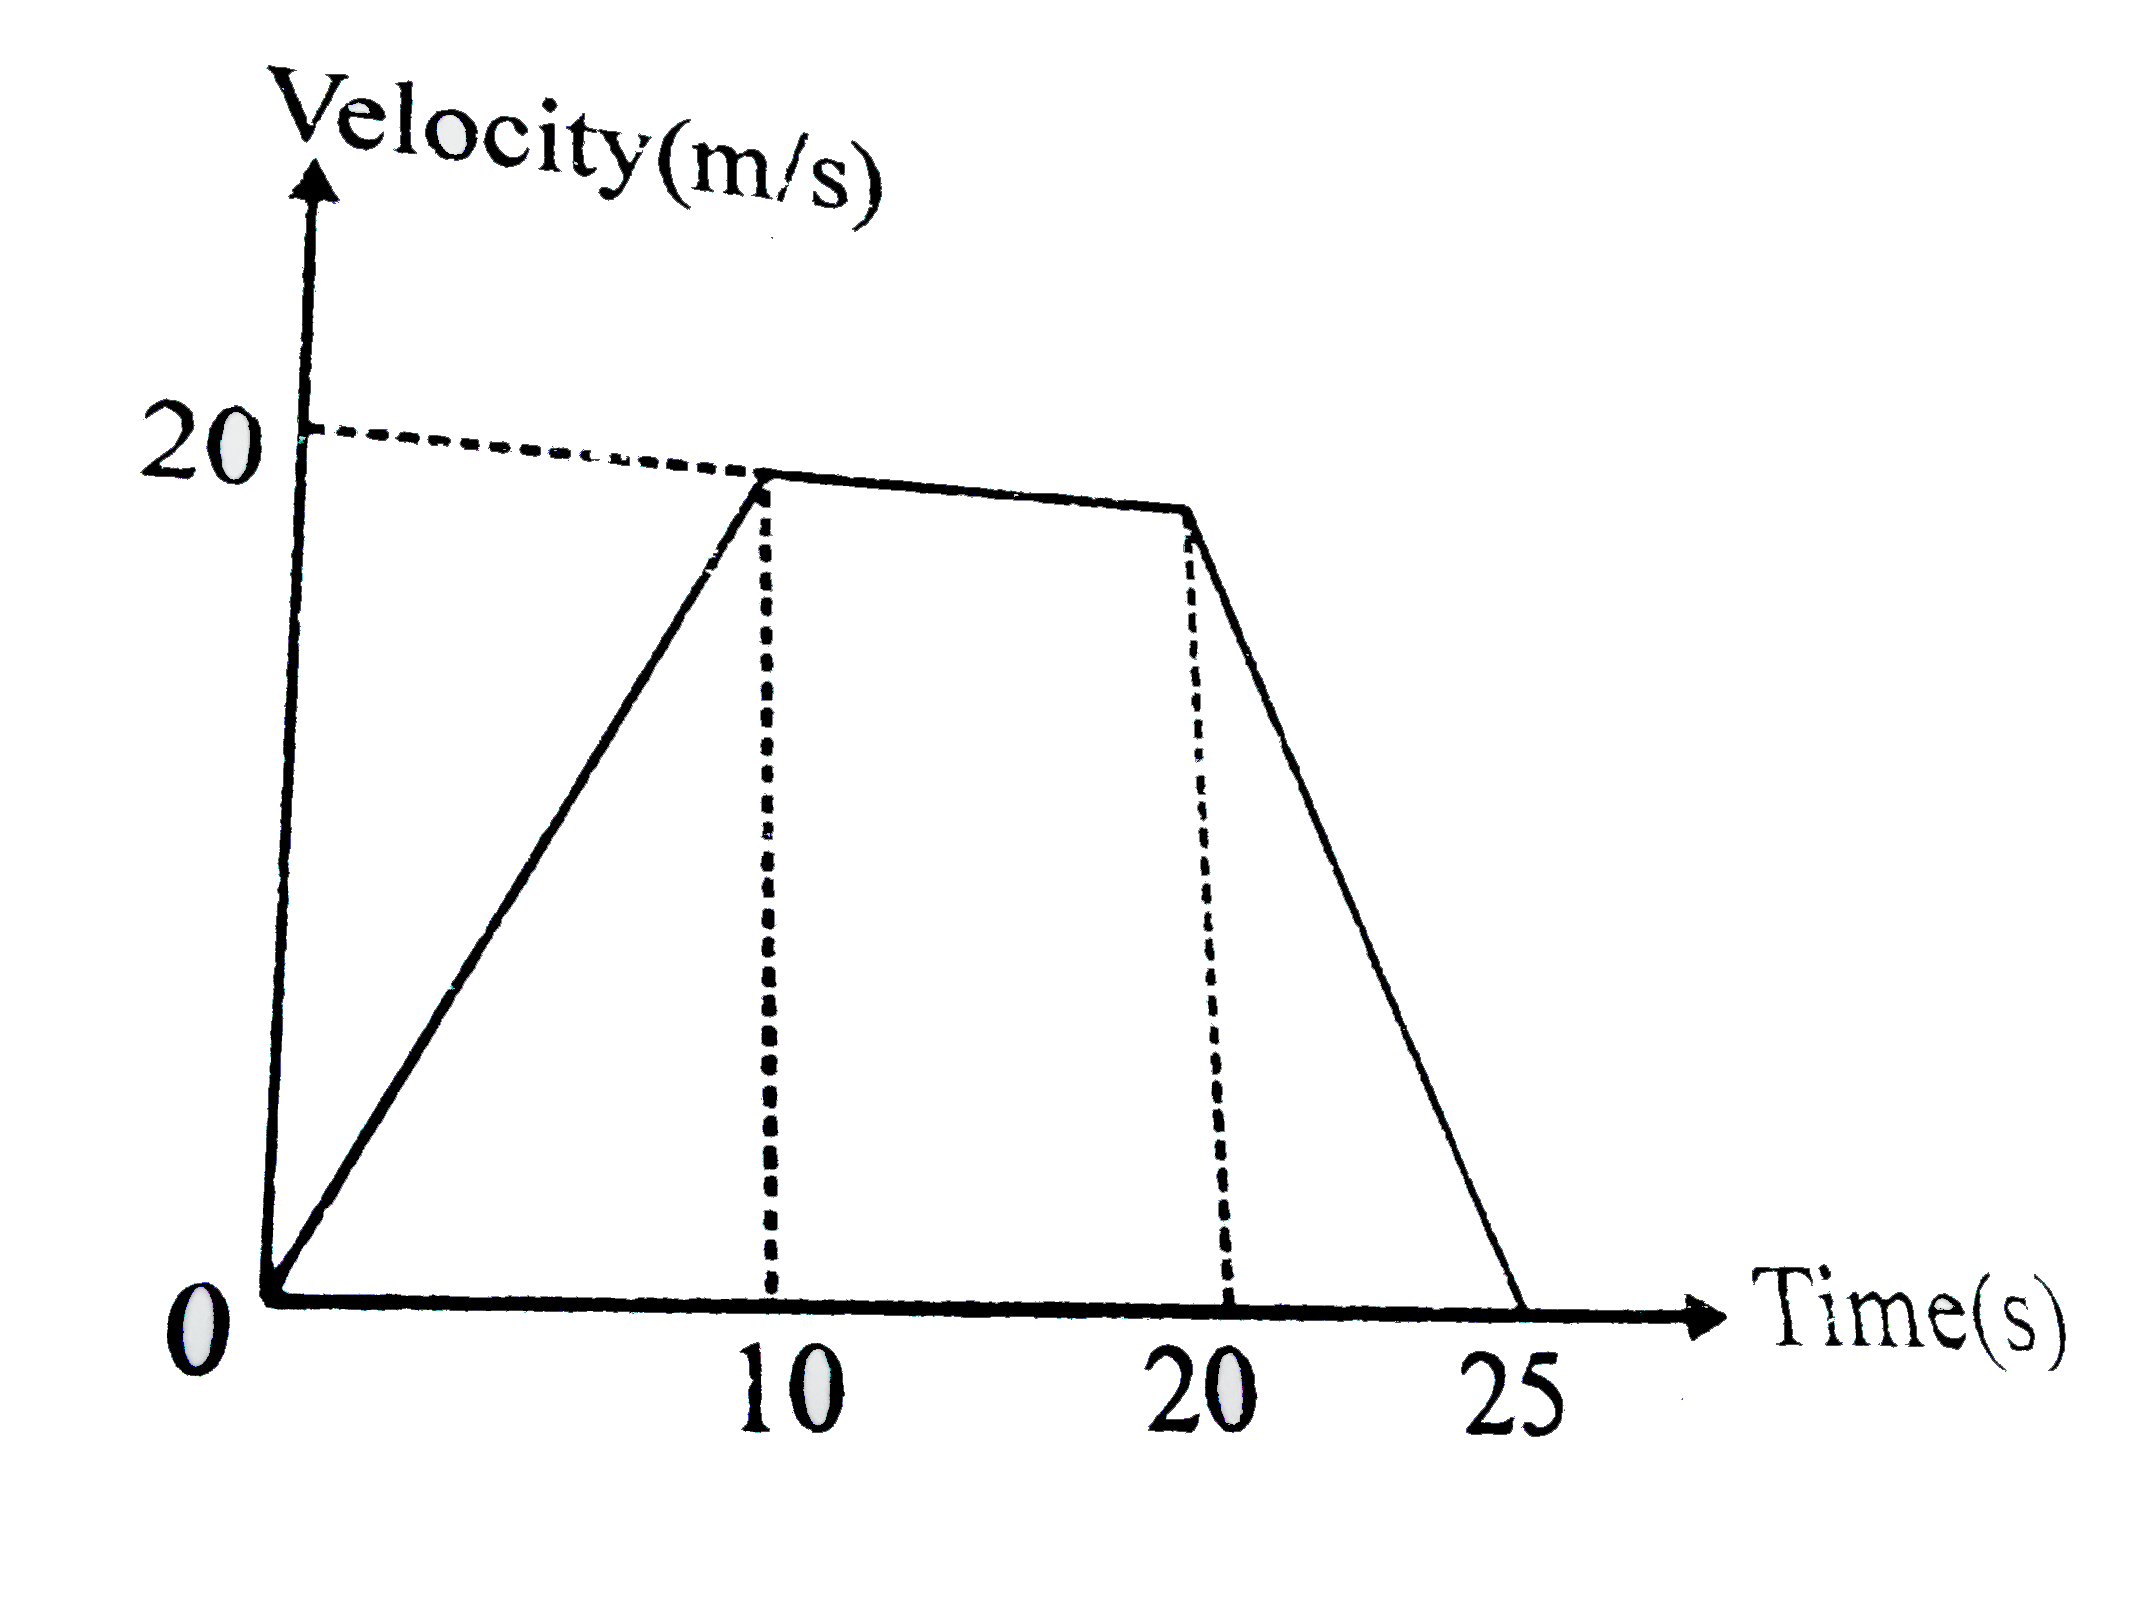
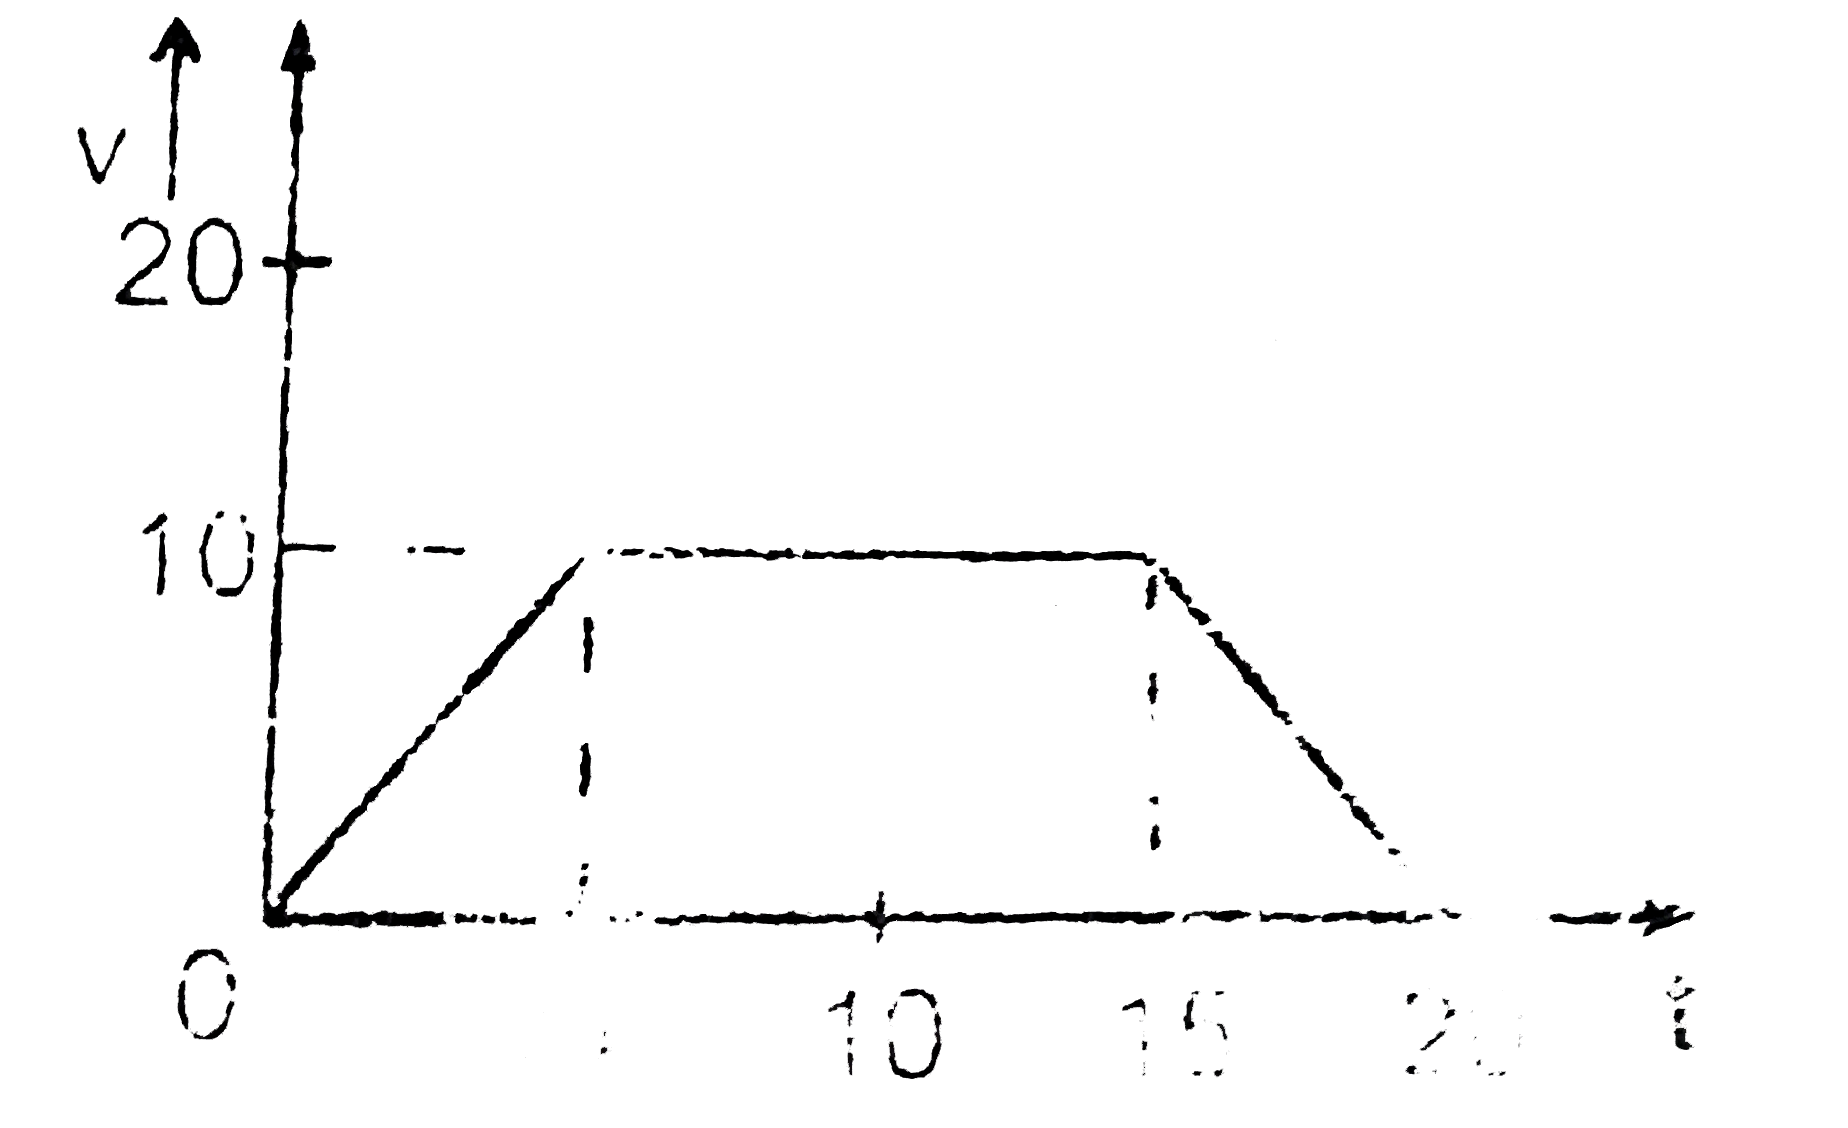
The velocity-time graph of a car moving along a straight road is shown in figure. The average velocity of the car in first 25 seconds is
A
20m/s
B
14m/s
C
10m/s
D
17.5m/s
Video Solution
Text Solution
The correct Answer is:B
Average velocity=∫250vdt25−0=Area ofv−tgraph betweent=0tot=25s25[(25+102)(20)]=14m/s
|
Updated on:21/07/2023
Topper's Solved these Questions
Similar Questions
Knowledge Check
- Question 1 - Select One
The velocity-time graph of a car moving along a straight road is shown in figure. The average velocity of the car is first 25 seconds is
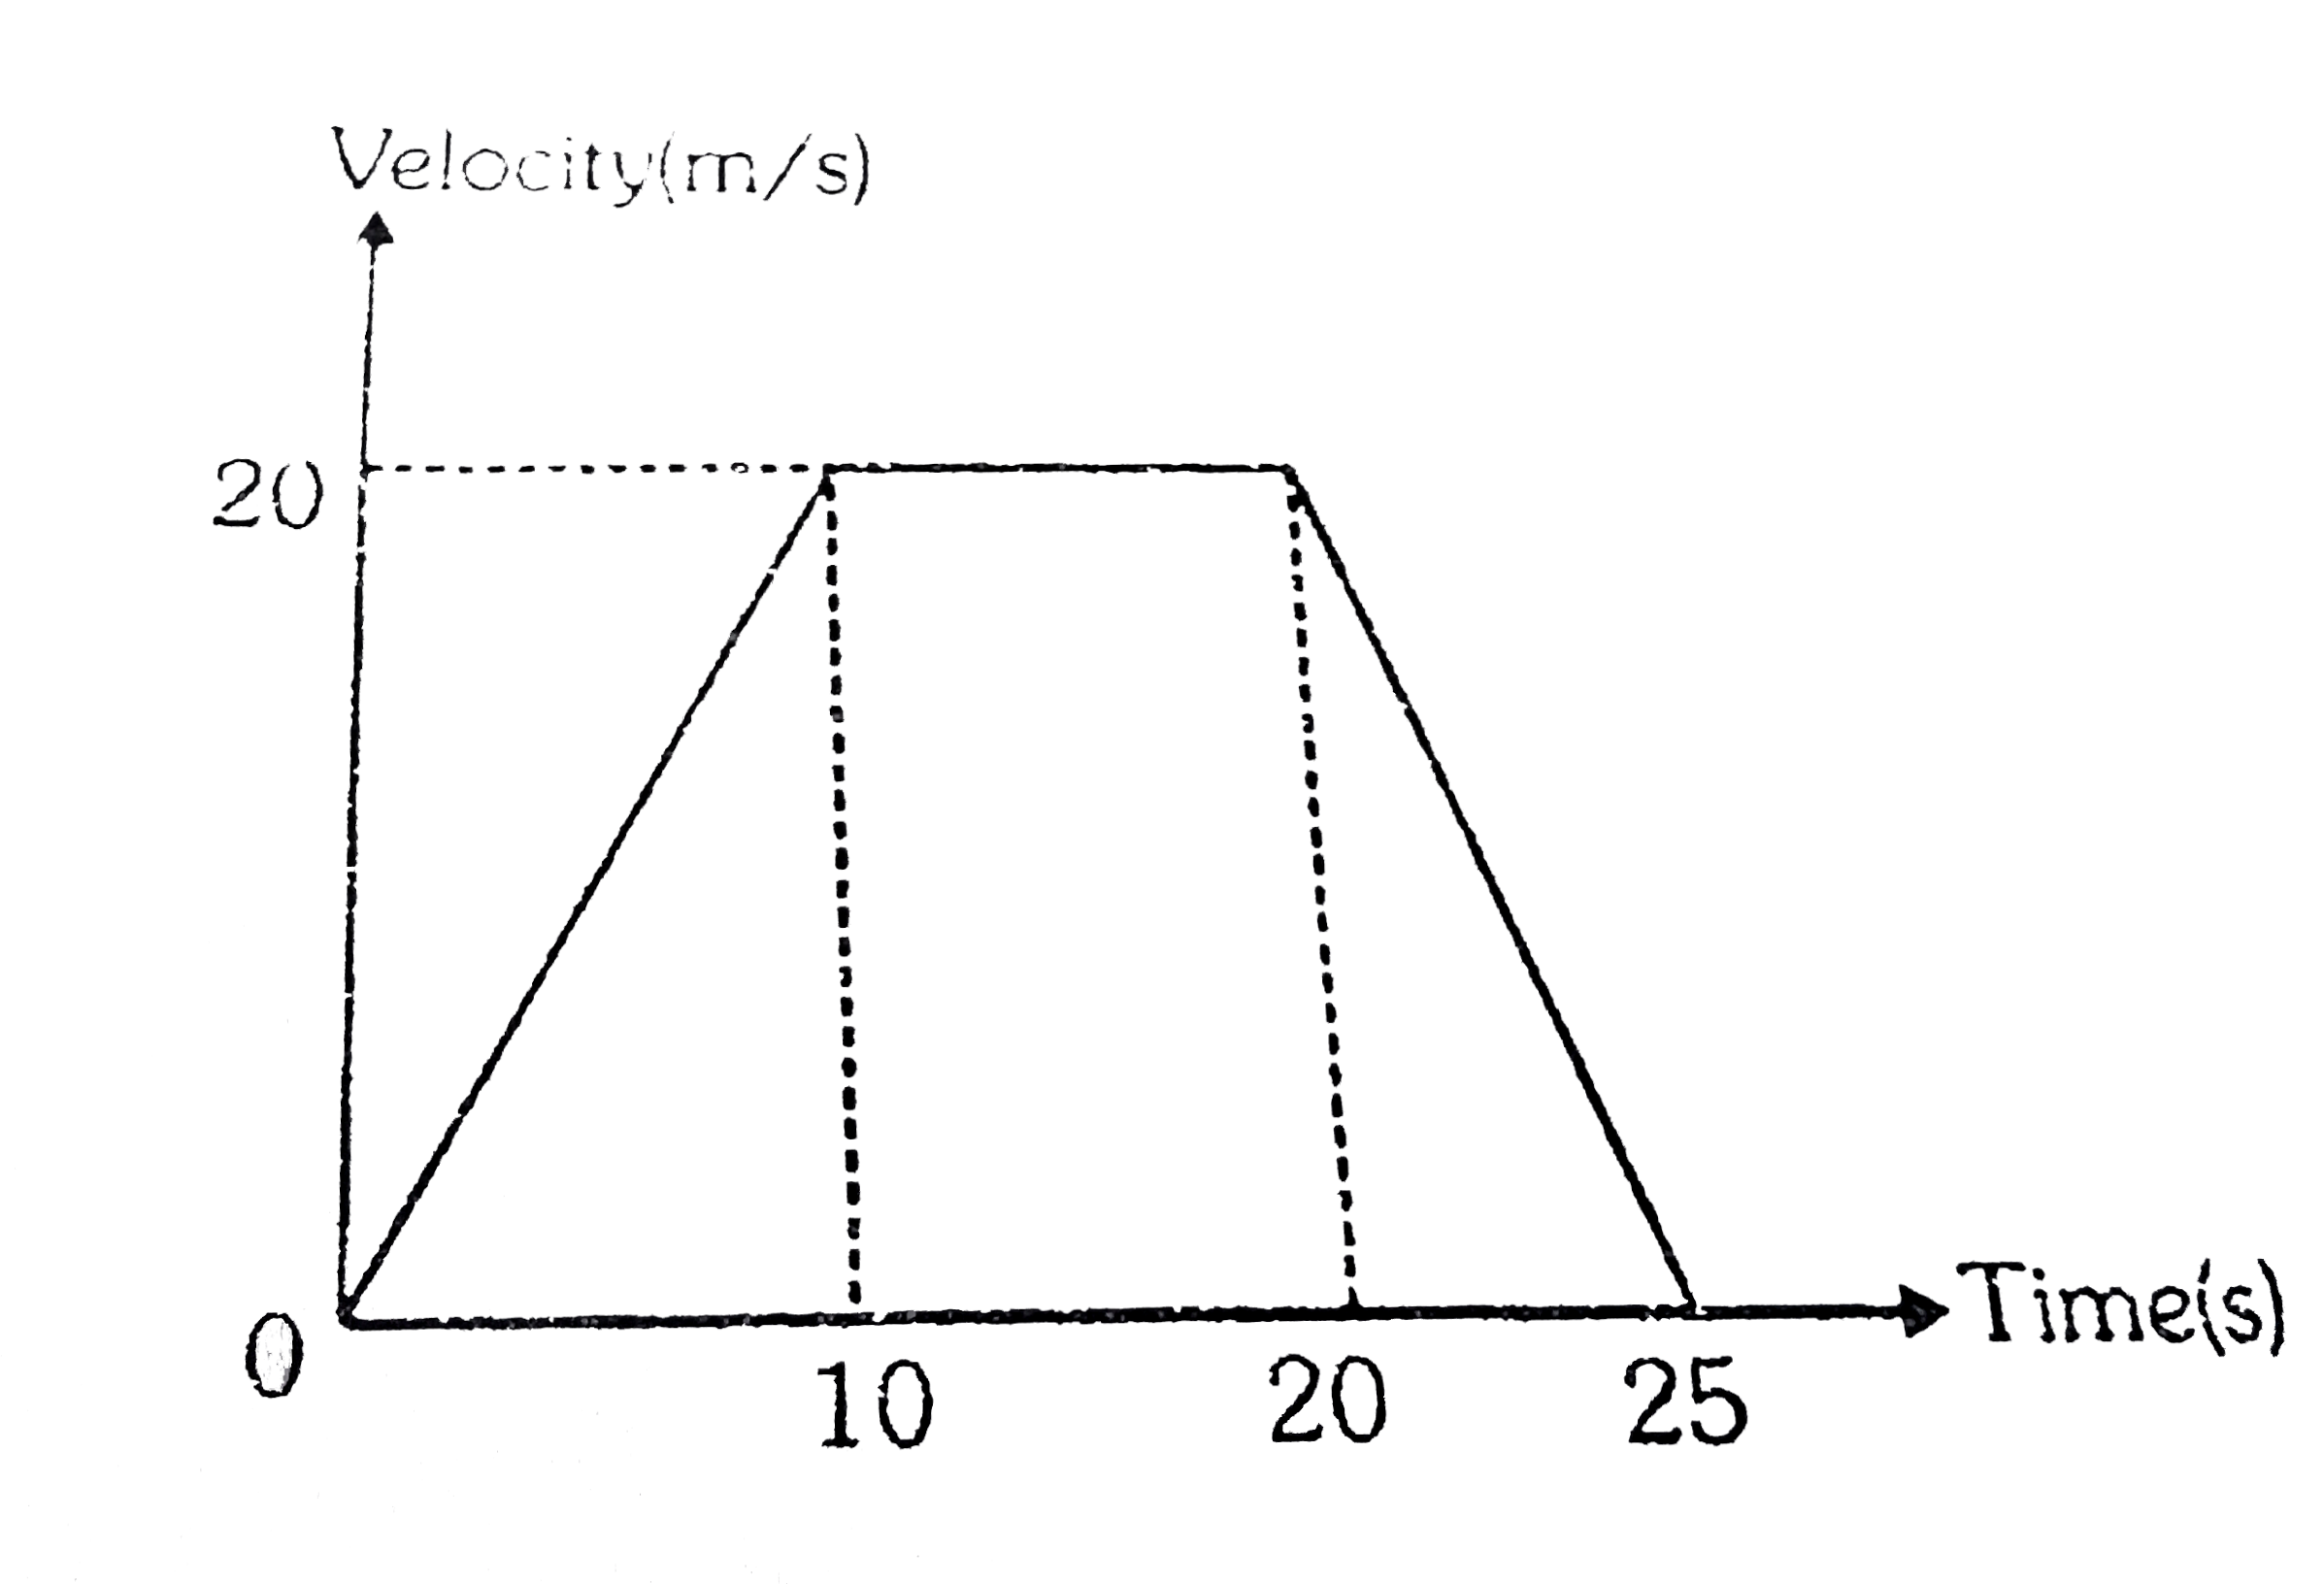 A20m/sB14m/sC10m/sD17.5m/s
 - Question 2 - Select One or More
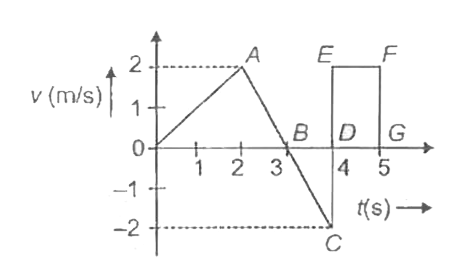
The velocity-time graph of a body moving in a straight line is shown in the figure.
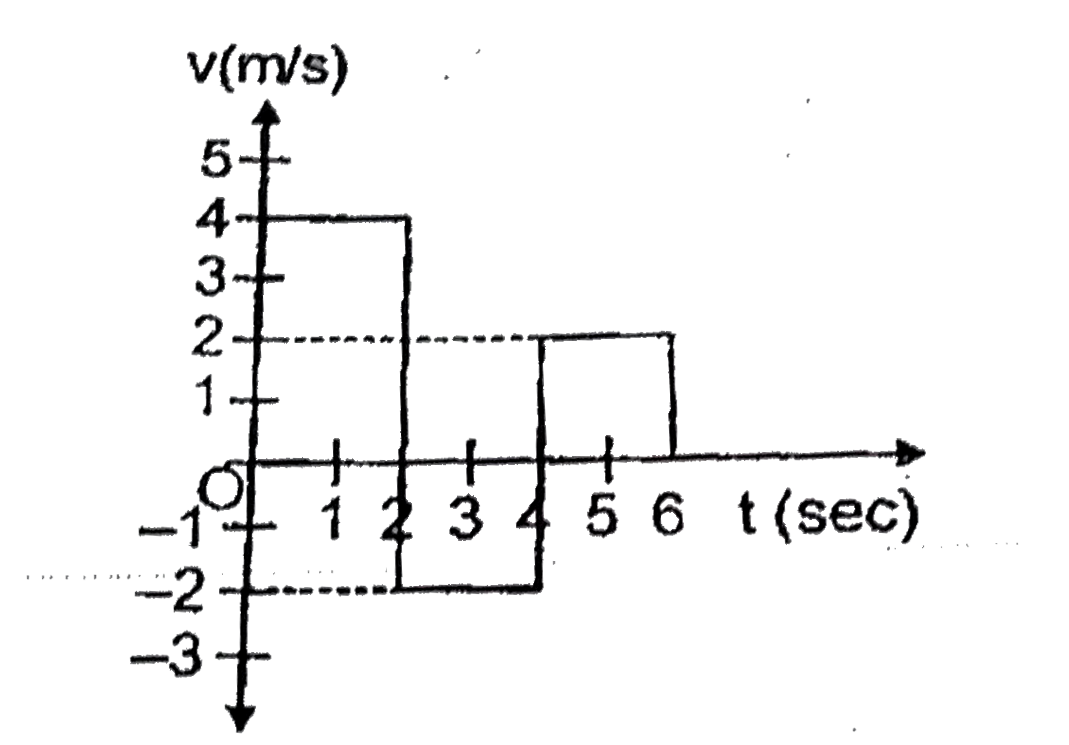 AThe magnitude of displacement of the body in 1st 2 sec is 8 mBThe magnitude of displacement of the body in 1st 4 sec is 4 mCThe distance travelled in 1st 2 sec is 8 mDThe distance travelled in 1st 4 sec is 12 m
 - Question 3 - Select One
The velocity time graph of a body moving along a straight line is shown in figure. The ratio of the average velocities during the time t1 and t2 is.
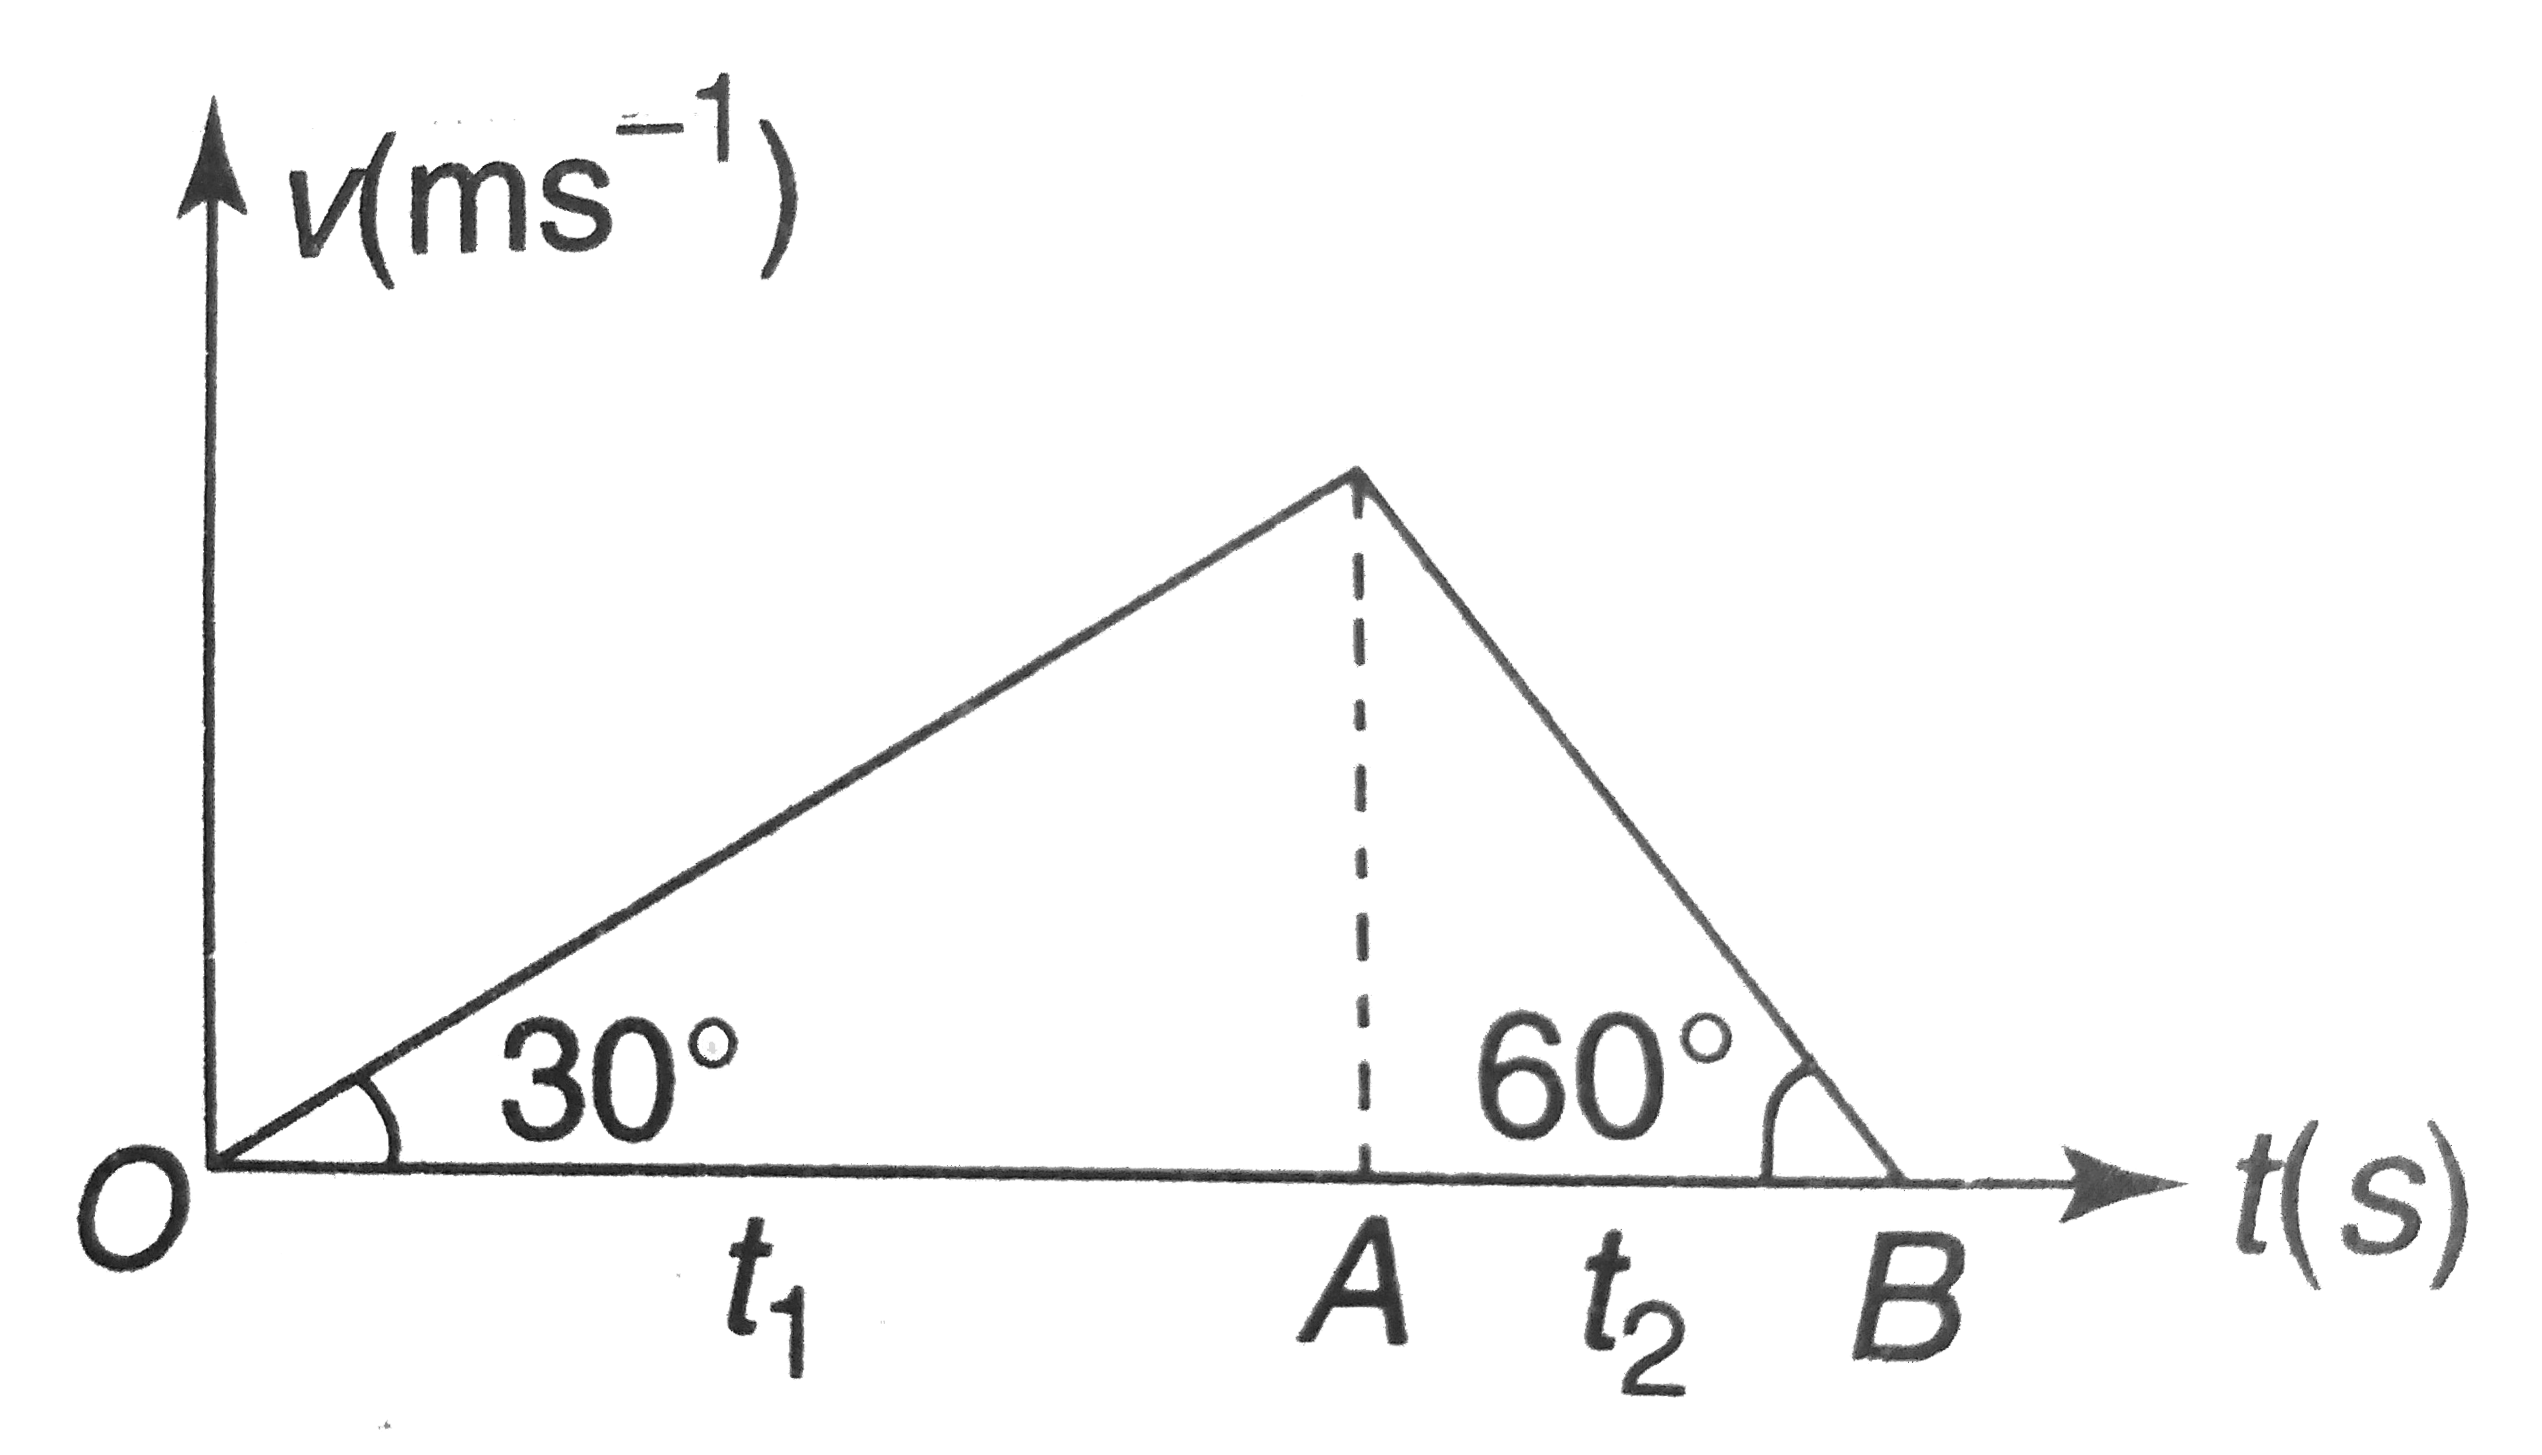 A1:1B2:1C3:1D1:3
The speed - time graph for a body moving along a straight line is shown in figure. The average acceleration of body may be
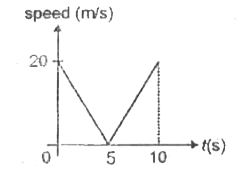 View Solution
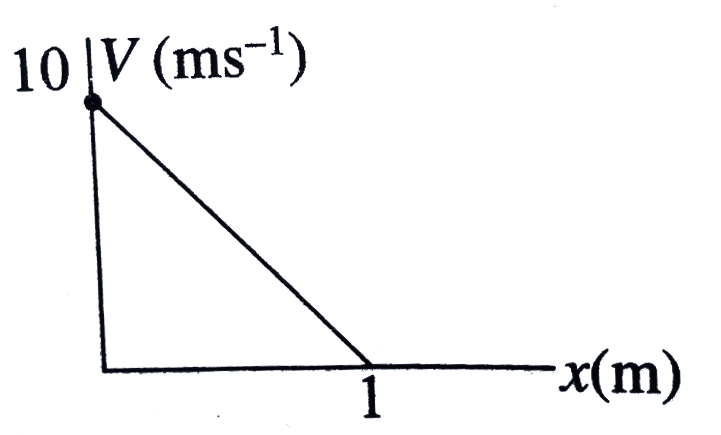
The velcocity displacement graph of a particle moving along a straight line is shown in figure. The velocity as function of x(0≤x≤1) isView SolutionVelocity displacement graph of a particle moving in a straight line is as shown in figure.
 View Solution
Figure shows the velocity time graph of a particle moving along straight line (v is m/s and t is in second). It average velocity in 20 seconds will be:
 .View Solution
The velocity - time graph of a particle moving along a straight line is shown in the figure given below
The displacement of the particle in 5 second isView Solution


