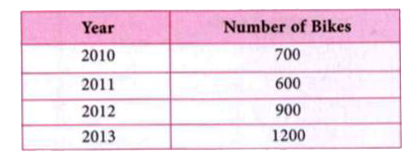
Following table shows the number of bicycles manufactured in a factory during the years 1998 to 2002. Illustrate this data using a bar graph. Choose a scale of your choice
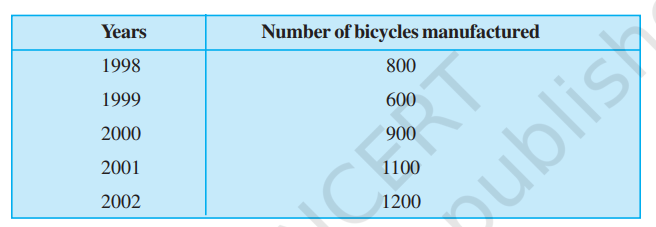
From the given information in the question, we have
(a) In 2002, the maximum number of bicycles were manufactured
(b) In 1999, the minimum number of bicycles were manufactured.
We may draw a bar graph of the above data as follows
Taking a scale of 1 unit length = 100 bicycles
Topper's Solved these Questions
- BOOK - NCERTCHAPTER - DATA HANDLINGEXERCISE - EXERCISE 9.17videos
DATA HANDLING
- BOOK - NCERTCHAPTER - DATA HANDLINGEXERCISE - EXERCISE 9.33videos
DATA HANDLING
- BOOK - NCERTCHAPTER - BASIC GEOMETRICAL IDEASEXERCISE - EXERCISE 4.64videos
BASIC GEOMETRICAL IDEAS
- BOOK - NCERTCHAPTER - DECIMALSEXERCISE - EXERCISE 8.110videos
DECIMALS
Similar Questions
Knowledge Check
- Question 1 - Select One
The bar graph shows the number of students (in hundreds) admitted and passed out per year in a college during the years 2010 to 2014.
Study the bar graph and answer the question.
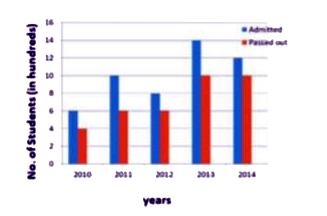
The ratio of the number of students admitted in the year 2012 to the average number of students passed out inthe years 2013 and 2014 isA4:7B4:5C2:5D3:5
Given here is a bar graph showing the number of cycles produced in a factory during five consecutive weeks.
Observe the graph and answer the questions based on this graph.
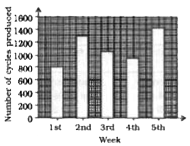
The number of cycles produced in the 5th week isView SolutionThe following table shows the interest of students of a school in different games :

Represent the data by using a simple bar diagram.View SolutionThe following table gives the data of number of schools (stage-wise) of a country in the year 2002.
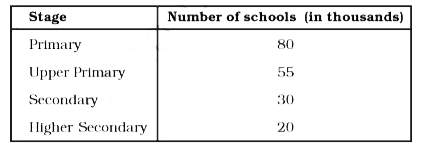
Draw a bar graph to represent the above data:View SolutionThe pictograph shows the number of bicycles made by a factory during the four weeks of a month. Answer the following questions.
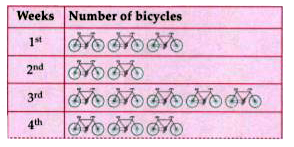

How many bicycles were made by the factory during 1st week ?View SolutionStudy the following table, which shows the number of units of a product manufactured and sold by a company in five years, and answer questions.
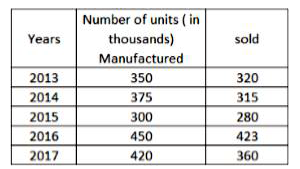
In which year the number of units of the product sold is 19000 more than the average number of units manufactured per year?View SolutionThe pictograph shows the number of bicycles made by a factory during the four weeks of a month. Answer the following questions.
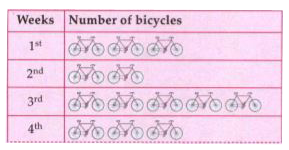

In which week maximum number of bicycles were made ?View SolutionThe pictograph shows the number of bicycles made by a factory during the four weeks of a month. Answer the following questions.
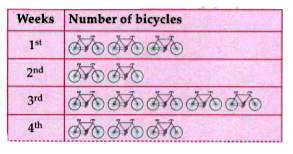

What is the difference between the number of bicycles made during 3rd week and 4th week ?View Solution


