Draw a bar graph using the data given in the following table, which shows the number of bikes manufactured in a factory during the years 2010 to 2013.
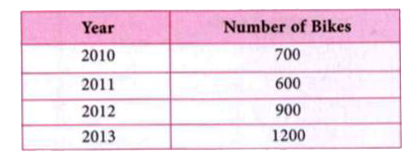
Step by step video & image solution for Draw a bar graph using the data given in the following table, which shows the number of bikes manufactured in a factory during the years 2010 to 2013. by Maths experts to help you in doubts & scoring excellent marks in Class 6 exams.
Updated on:21/07/2023Topper's Solved these Questions
- PREP TEST BOOK - MTG IIT JEE FOUNDATIONCHAPTER - PREP TEST EXERCISE - SECTION-B
38 Videos
- PRACTICAL GEOMETRY BOOK - MTG IIT JEE FOUNDATIONCHAPTER - PRACTICAL GEOMETRY EXERCISE - EXERCISE (SUBJECTIVE PROBLEMS) (LONG ANSWER TYPE )
5 Videos
- PREP TEST -1BOOK - MTG IIT JEE FOUNDATIONCHAPTER - PREP TEST -1EXERCISE - SECTION-B
35 Videos
Similar Questions
Following table shows the number of bicycles manufactured in a factory during the years 1998 to 2002. Illustrate this data using a bar graph. Choose a scale of your choice
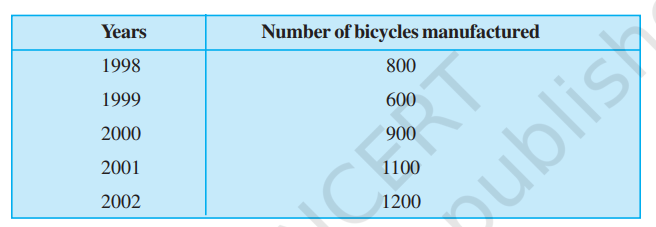
View SolutionFollowing table shows the number of bicycles manufactured in a factory during the years 1998 to 2002. Illustrate this data using a bar graph. Choose a scale of your choice.
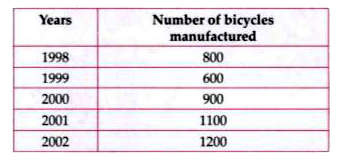
In which year were the maximum number of bicycles manufactured ?
View SolutionFollowing table shows the number of bicycles manufactured in a factory during the years 1998 to 2002. Illustrate this data using a bar graph. Choose a scale of your choice.
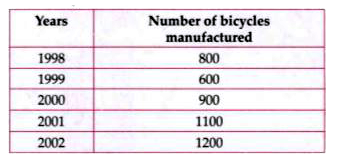
In which year were the minimum number of bicycles manufactured ?
View SolutionThe following table shows the number of fruits in a fruit shop. Represent the above data by a bar graph
View SolutionDraw a multiple bar diagram to show the following data :

View SolutionStudy the following bar diagram carefully and answer the following questions. The number of the production of electronic items (TVs and LCDs) in a factory during the period from 2009 to 2013.
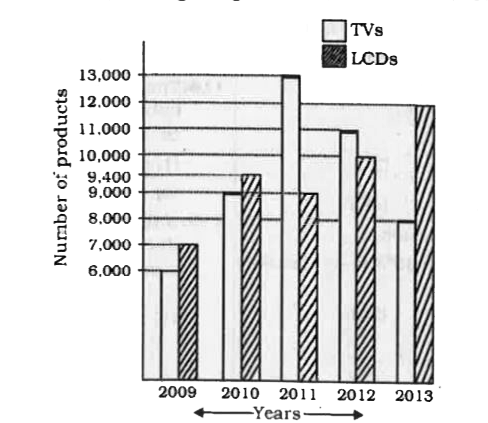
The ratio of production of TVs in the years 2009 and 2010 is
View SolutionStudy the following bar diagram carefully and answer the following questions. The number of the production of electronic items (TVs and LCDs) in a factory during the period from 2009 to 2013.
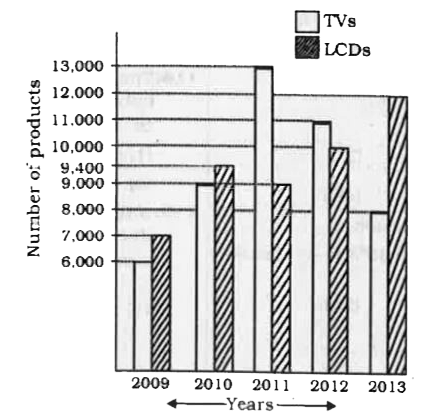
The ratio of production of LCDs in the year 2011 and 2013 is
View SolutionStudy the following bar diagram carefully and answer the following questions. The number of the production of electronic items (TVs and LCDs) in a factory during the period from 2009 to 2013.
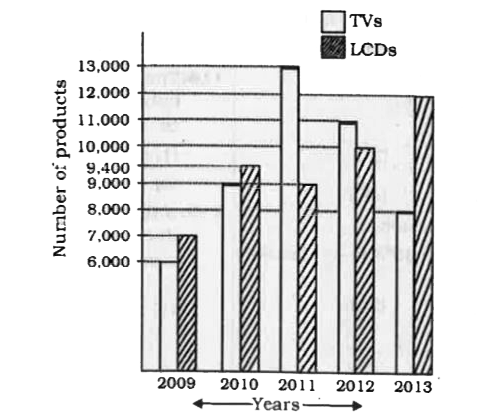
The total number of production of electronic items is maximum in the year
View SolutionThe given bar graph presents the data of annual income and annual expenditure of an IT officier in a multinational company during the years 2012 to 2016.
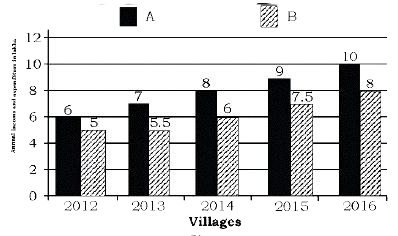
For which pair of years, the ratio of savings to expenditure is equal.
View SolutionTake the data giving the minimum and the maximum temperature of various cities given in the table.
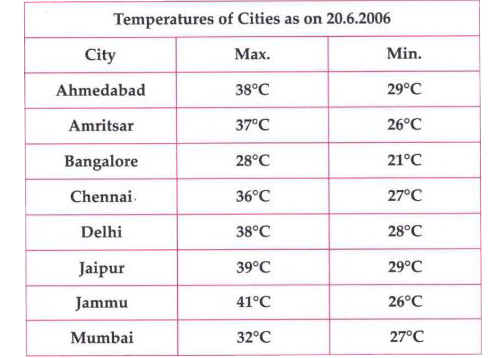
Which city has the largest difference in the minimum and maximum temperature on the given date ?
View Solution
