The bar-chart is showing the number of accidents in a city during the first six month of a year. Examine the bar chart and answer the following questions.
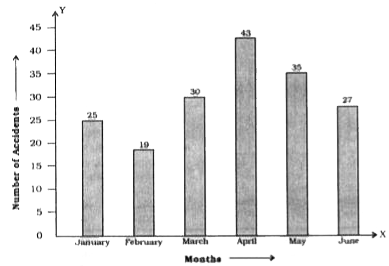
Compared to the month of January, what is the percentage of decrease in accidents in the month of February?
25
24
30
27
The correct Answer is:B
Step by step video & image solution for The bar-chart is showing the number of accidents in a city during the first six month of a year. Examine the bar chart and answer the following questions. Compared to the month of January, what is the percentage of decrease in accidents in the month of February? by Maths experts to help you in doubts & scoring excellent marks in Class 14 exams.
Updated on:21/07/2023Topper's Solved these Questions
- STATISTICS AND DATA INTERPRETATIONBOOK - KIRAN PUBLICATIONCHAPTER - STATISTICS AND DATA INTERPRETATIONEXERCISE - TYPE-III
39 Videos
- STATISTICS AND DATA INTERPRETATIONBOOK - KIRAN PUBLICATIONCHAPTER - STATISTICS AND DATA INTERPRETATIONEXERCISE - TYPE-IV
182 Videos
- STATISTICS AND DATA INTERPRETATIONBOOK - KIRAN PUBLICATIONCHAPTER - STATISTICS AND DATA INTERPRETATIONEXERCISE - TYPE-VIII
8 Videos
- SIMPLIFICATIONBOOK - KIRAN PUBLICATIONCHAPTER - SIMPLIFICATIONEXERCISE - TEST YOURSELF
25 Videos
- TIME AND DISTANCEBOOK - KIRAN PUBLICATIONCHAPTER - TIME AND DISTANCEEXERCISE - Type -XI
74 Videos
Similar Questions
The bar-chart is showing the number of accidents in a city during the first six month of a year. Examine the bar chart and answer the following questions.
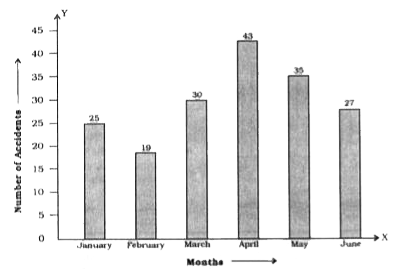
What is the percentage of accidents in the month of April to the total accidents in the city ?
View SolutionThe bar-chart is showing the number of accidents in a city during the first six month of a year. Examine the bar chart and answer the following questions.
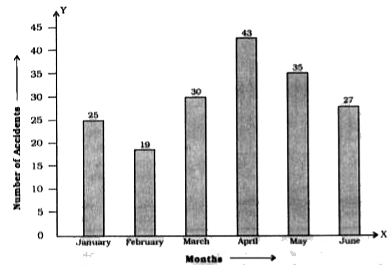
Percentage of decrease in t he number of accidents from May to June is :
View Solution
Knowledge Check
Given is a line graph showing the number of accidents in a city during the first 6 months of 1999.
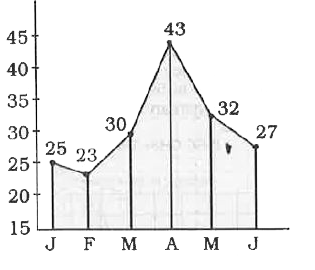
The decrease % of accidents from May to June isA1538%B1518%C1558%D1578%Given below is the bar graph showig the number of scooters produced in a factory during the first five months of a year.
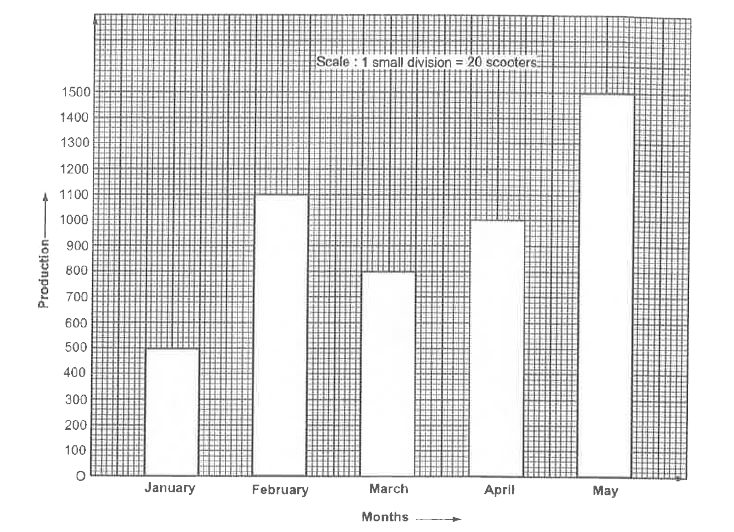
Read the above bar graph carefully nd answer the question given below:
How many scooters were produced in the month of March?
What was the increase in proudction in Feberuary over the production in January ?
What was teh decrease in proudction in March in comparison to the production in February ?
In which month was the production minimum and what was it ?A(i) 800 scooters
(ii) 600 scooters
(iii) 300 scooters less in March
(iv) Minimum production in january =500B(i) 700 scooters
(ii) 500 scooters
(iii) 300 scooters less in March
(iv) Minimum production in january =500C(i) 900 scooters
(ii) 600 scooters
(iii) 300 scooters less in March
(iv) Minimum production in january =200D(i) 750 scooters
(ii) 550 scooters
(iii) 300 scooters less in March
(iv) Minimum production in january =500Study the bar chart given below and answer the following questions :
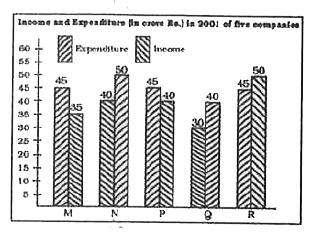
The company earning the maximum percentage of profit in the year 2001 is :AQBMCNDP
The bar-chart is showing the number of accidents in a city during the first six month of a year. Examine the bar chart and answer the following questions.
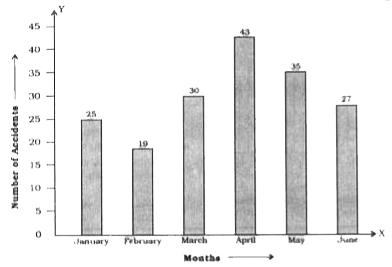
By what number, is the number of accidents that occurred in April is greater than the average number of accidents that occured during the 6 months period ?
View SolutionThe line chart given below represents the sales ( in 00) of trousers and shirts for five months .
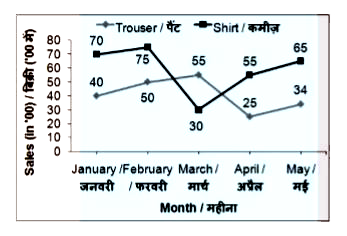
What is the percentage decrease in the sales of the trousers from February to March?
View SolutionThe following Bar chart shows the sales of a company XYZ (in Rs Crore). Study the chart and answer the following questions.
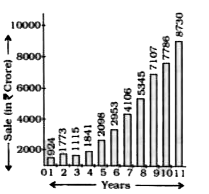
The 2nd least sale is in the year :
View SolutionThe number of road accidents in a city is increasing month by month as given below. Find out the number of accidents in the month of June.

View SolutionIn the following questions, study the two pie-charts and answer the questions.
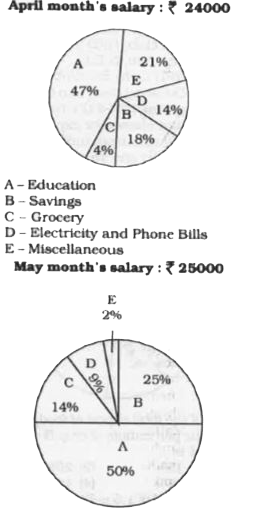
What is the percent increase in Education in May month than April month ?
View Solution
