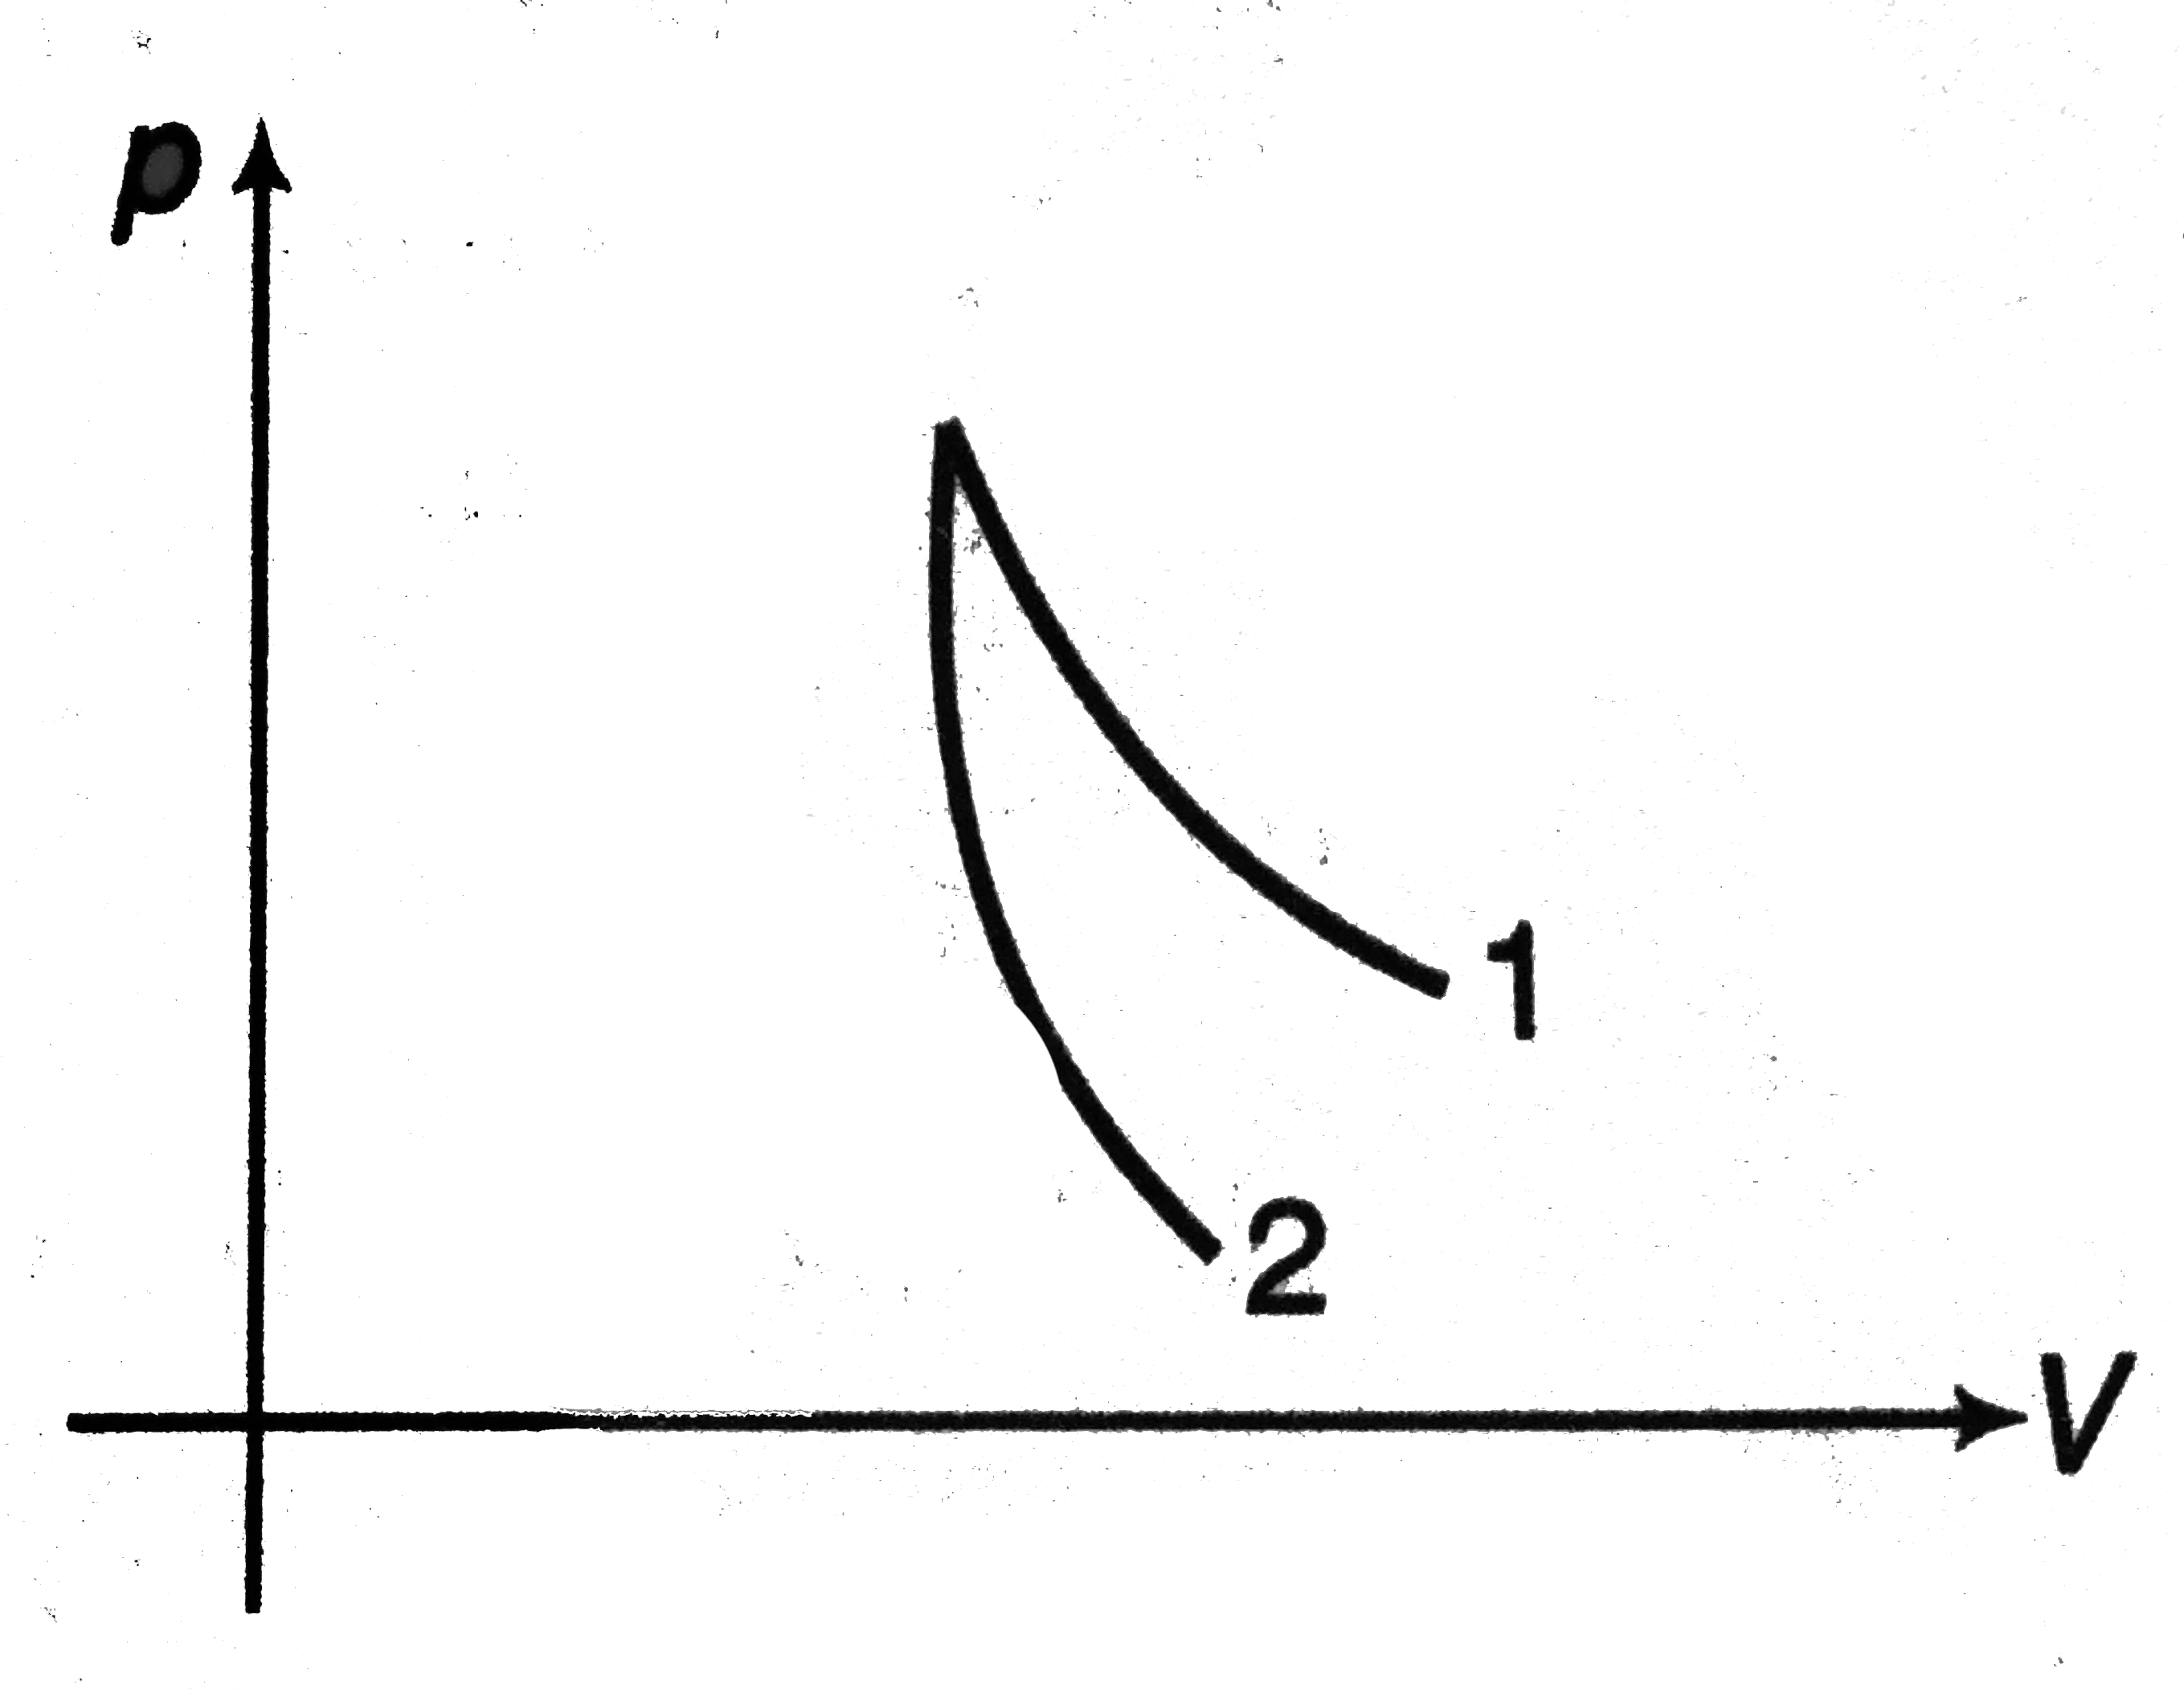
P.V plotsfortwo gases during adiabatic processses are shown in the figure Plots 1 and 2 should correspond respectively to
A
He and
B
and He
C
He and Ar
D
and
Text Solution
Slope of the curve
Also for monoatomic gas and for atomic gas
Hence a is correct.
|
Topper's Solved these Questions
- HEAT AND TEMPERATUREBOOK - FIITJEECHAPTER - HEAT AND TEMPERATUREEXERCISE - COMPREHENSION TYPE
5 Videos
- HEAT AND TEMPERATUREBOOK - FIITJEECHAPTER - HEAT AND TEMPERATUREEXERCISE - ASSERTION REASON TYPE
1 Videos
- HEAT AND TEMPERATUREBOOK - FIITJEECHAPTER - HEAT AND TEMPERATUREEXERCISE - SOLVED PROBLEMS SUBJECTIVE
18 Videos
- GRAVITATIONBOOK - FIITJEECHAPTER - GRAVITATIONEXERCISE - Numerical based Question
2 Videos
- KINEMATICSBOOK - FIITJEECHAPTER - KINEMATICSEXERCISE - NUMERICAL BASED QUESTIONS DECIMAL TYPE
5 Videos
Similar Questions
Knowledge Check
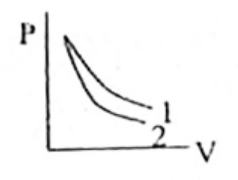
P-V plots for two gases during adiabatic processes are shown in the figure. Plots 1 and 2 should corresponds respectively to
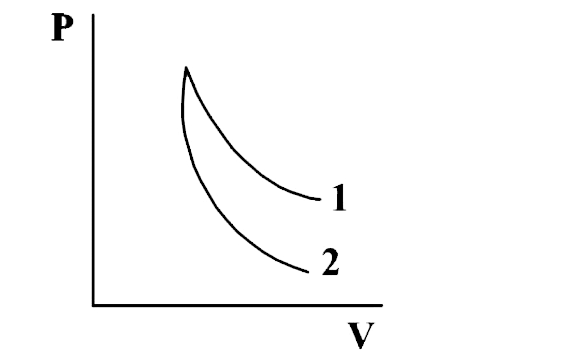 AHeandO2BO2andHeCHeandArDO2andN2
P-V plots for two gases during adiabatic processes are shown in the figure. Plots 1 and 2 should corresponds respectively to
 AHe and O2BO2 and HeCHe and ArDO2 and N2
P−V plots for two gases during P4 adiabatic process are shown in the figure. Plots 1 and 2 should correspond respectively to
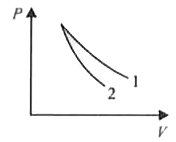 AHe and O2BO2 and HeCHe and ArDO2 and N2.
P-V plots for two gases during adiabatic processes are shown in the figure. Plots 1 and 2 should corresponds respectively to

View SolutionP - V plots for two gases, undergoing adiabatic processes are as shown in the figure.
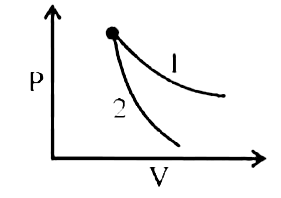
Plots 1 and 2 should correspond respectively to
View SolutionP-V plots for two gases during adiabatic processes are shown in Fig. 15.9.6. Plot 1 and 2 should correspond respectively to
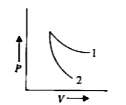
View SolutionP-V plots for two gases during adiabatic processes are shown in the figure. Plots 1 and 2 should corresponds respectively to

View SolutionP−V plots for two gases during adiabatic expansion are shown in figure. Plot I and II should correspond respectively to :
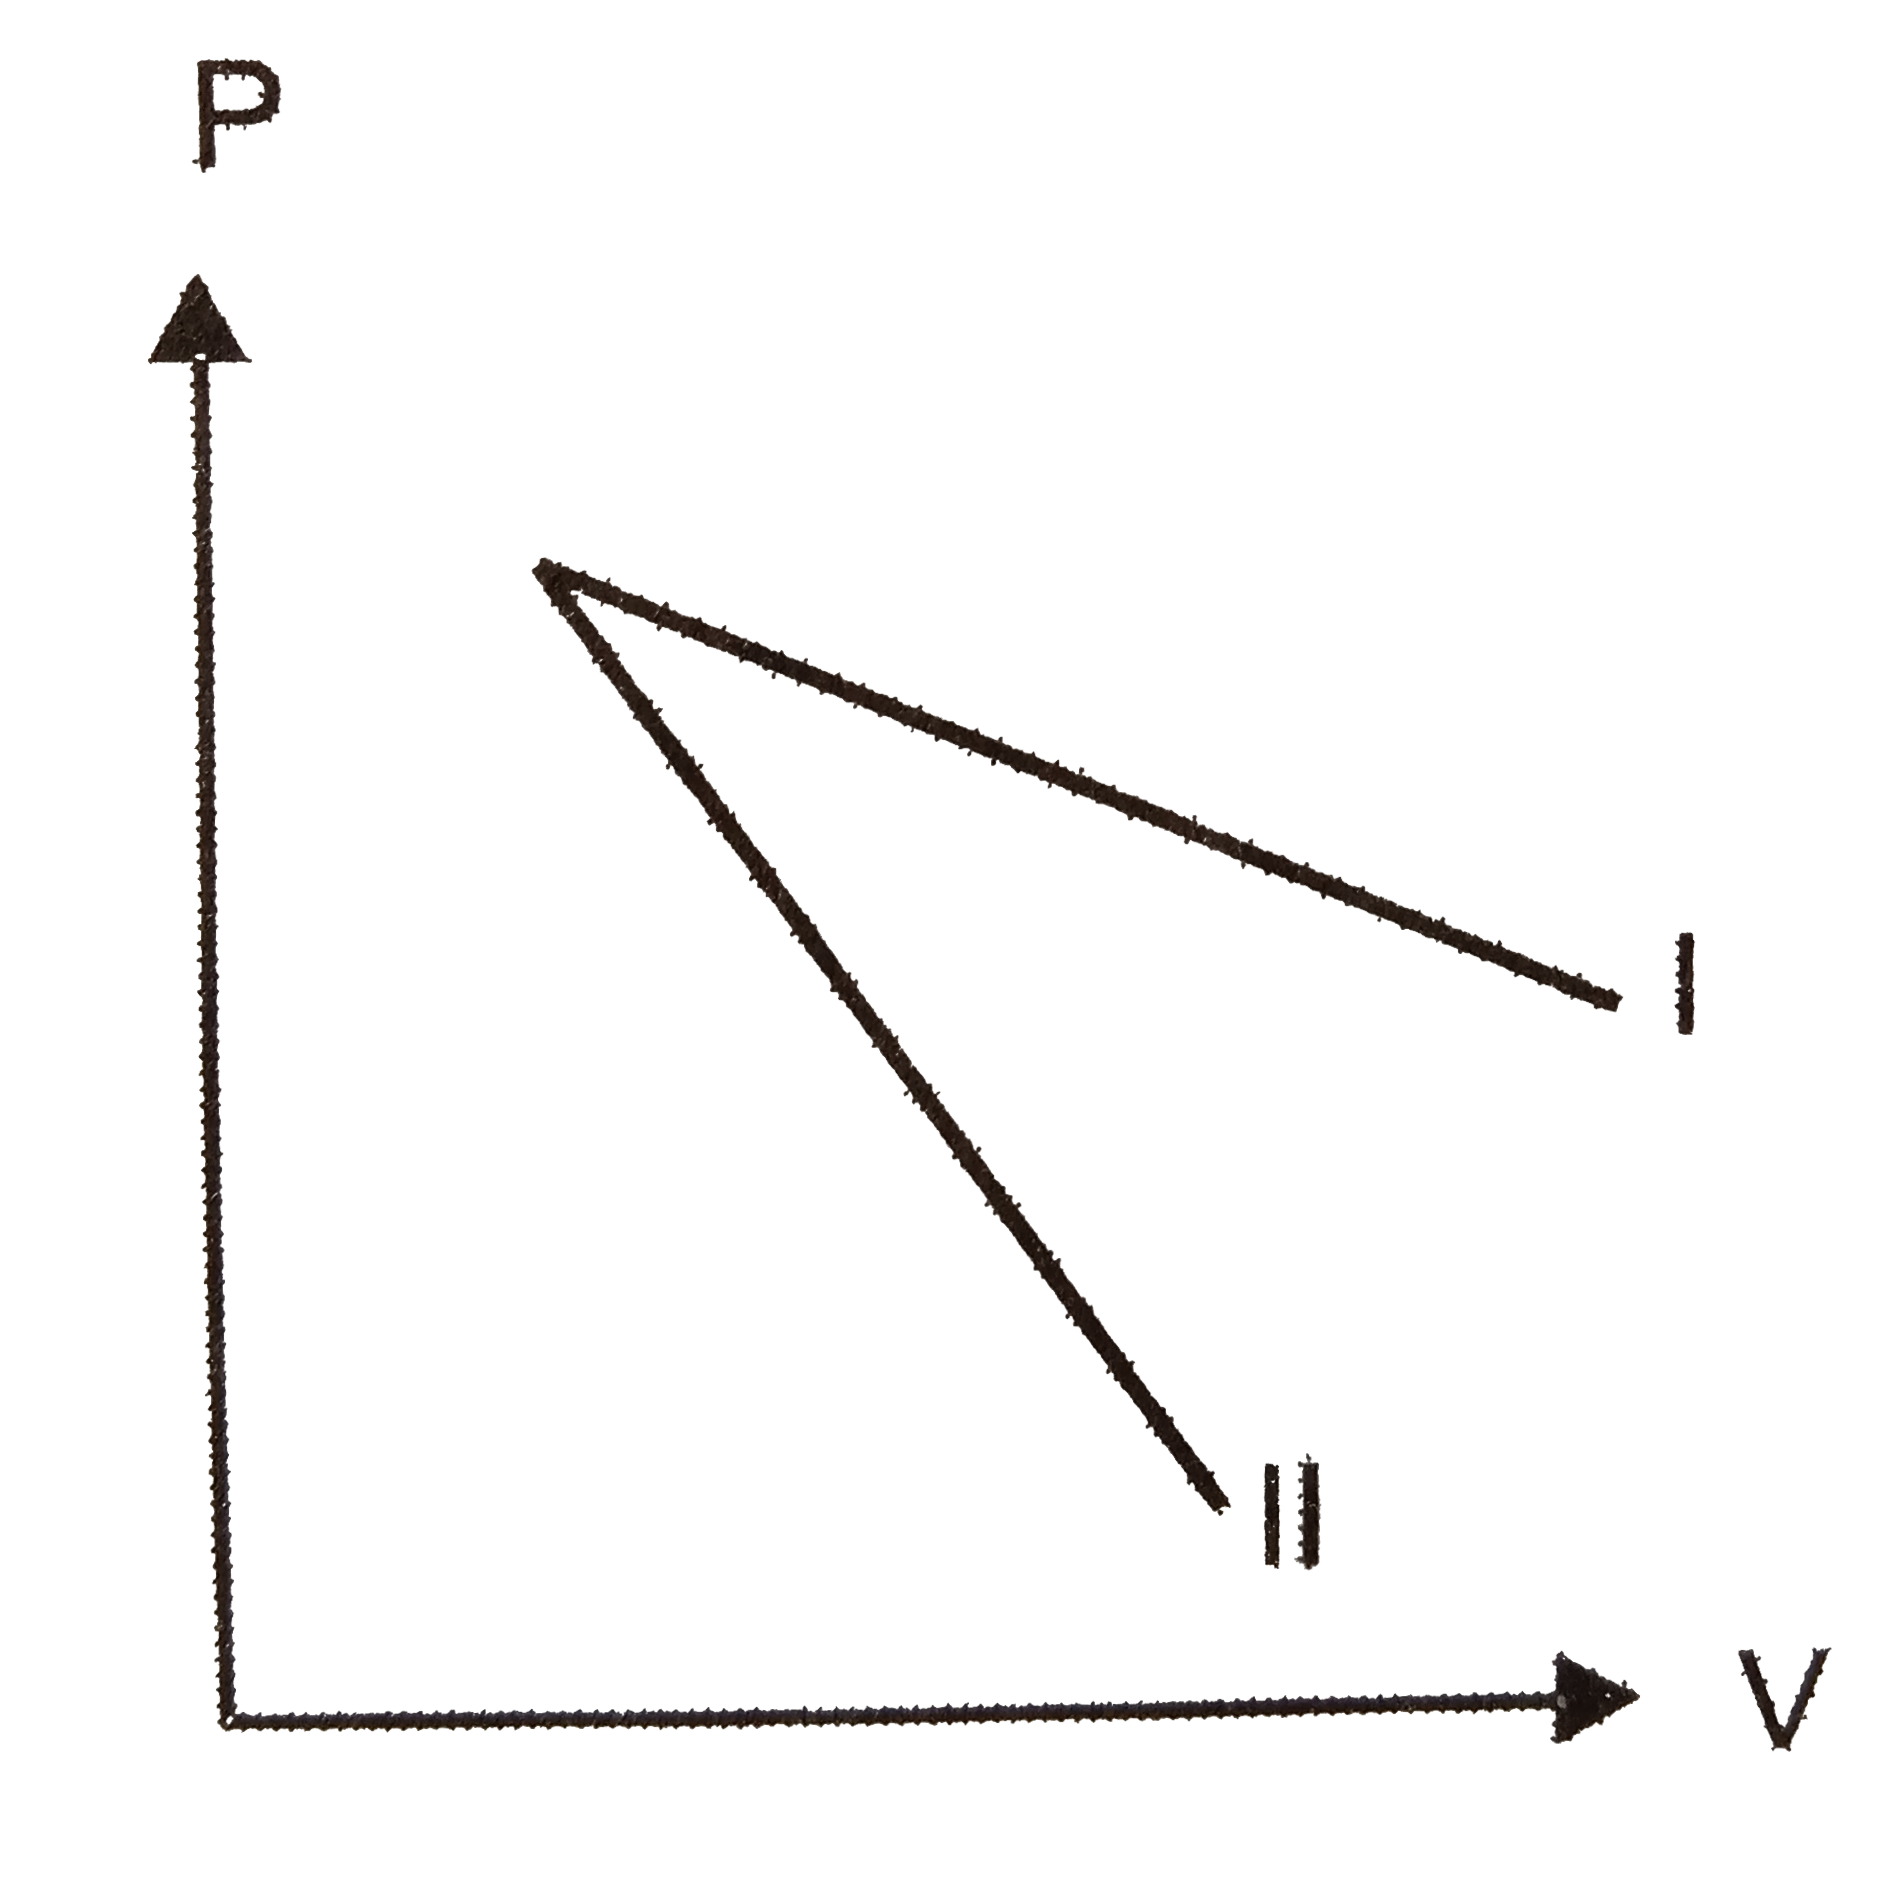
View Solution

