Which of the following graphs shows most significant deviation from ideal gas behavior
A
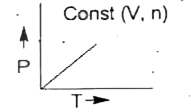
B
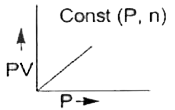
C
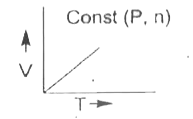
D
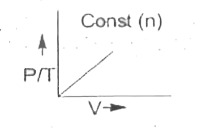
Text Solution
The correct Answer is:D
|
Topper's Solved these Questions
- GASEOUS STATEBOOK - FIITJEECHAPTER - GASEOUS STATEEXERCISE - ASSIGNMENT PROBLEMS (OBJECTIVE) LEVEL-II
20 Videos
- GASEOUS STATEBOOK - FIITJEECHAPTER - GASEOUS STATEEXERCISE - ASSIGNMENT PROBLEMS (OBJECTIVE) LEVEL-II COMPREHENSION-I
5 Videos
- GASEOUS STATEBOOK - FIITJEECHAPTER - GASEOUS STATEEXERCISE - ASSIGNMENT PROBLEMS (SUBJECTIVE) LEVEL-2
9 Videos
- ENVIRONMENTAL CHEMISTRYBOOK - FIITJEECHAPTER - ENVIRONMENTAL CHEMISTRYEXERCISE - ASSIGNMENT PROBLEMS (OBJECTIVE) LEVEL -II (MULTIPLE CORRECT QUESTIONS)
20 Videos
- GENERAL ORGANIC CHEMISTRYBOOK - FIITJEECHAPTER - GENERAL ORGANIC CHEMISTRYEXERCISE - SINGLE INTEGER ANSWER TYPE QUESTIONS
14 Videos
Similar Questions
Knowledge Check
Which of the following graphs show most significant deviation from ideal gas behaviour ?
A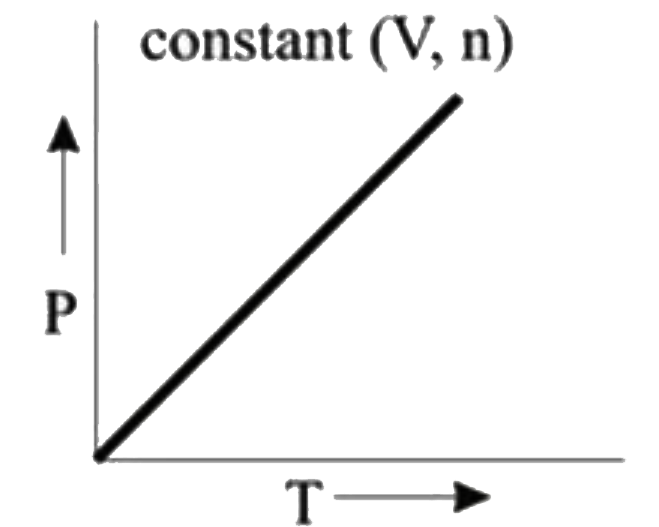 B
B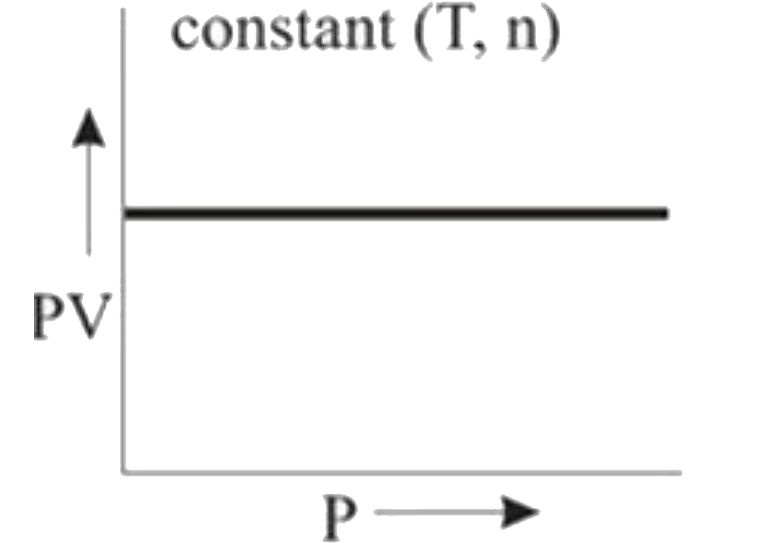 C
C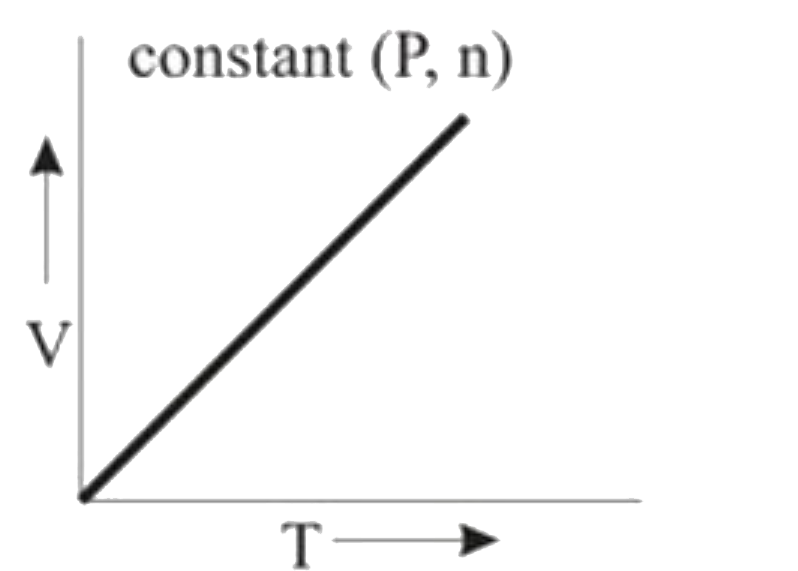 D
D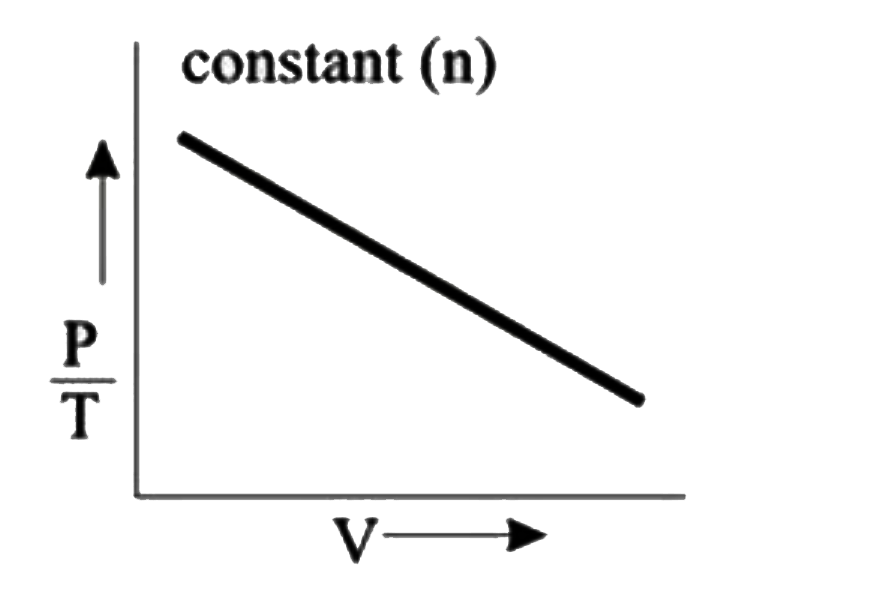
Solution among the following is/are showing singnificant deviation from ideal behaviour :
AC6H6+C6H5CHBC2H5OH+H2OCCHCl3+CH3COCH3DC5H5N+H2OAny gas shows maximum deviation from ideal gas behaviour at
A0∘C and 1 atmospheric pressureB100∘C and 2 atmospheric pressureC–100∘C and 5 atmospheric pressureD500∘C and 1 atmospheric pressure
Which of the following gas always shows positive deviation from ideal gas behaviour ?
View SolutionAny gas shows maximum deviation from ideal gas behaviour at
View SolutionWhich of the following graph is incorrect for an ideal gas?

View SolutionWhich of the following graph is incorrect for an ideal gas?

View SolutionWhich of the following graphs is not a straight line for an ideal gas ?
View Solution
