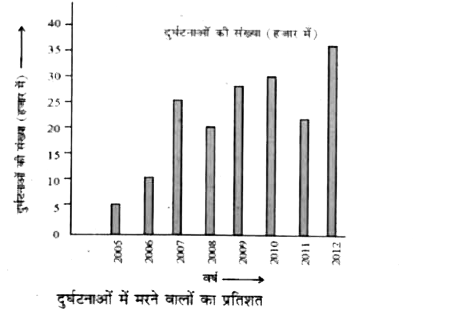
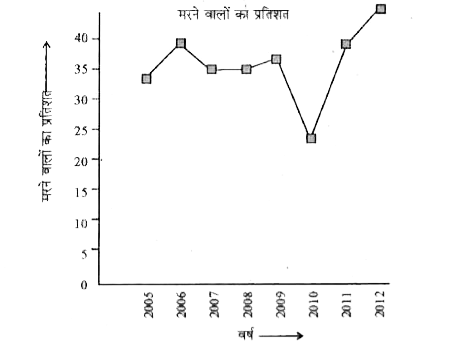
निम्नलिखित प्रश्न निम्नांकित ग्राफो पर आधारित है। दुर्घटनाओं की संख्या (हजार में)


(i) वर्ष 2005 में दुर्घटनाओं में मरने वालो की संख्या का क्या अनुपात है ?
(ii) किस वर्ष मरने वालो की संख्या न्यूनतम है ?
(iii) वर्ष 2010 से 2011 तक दुर्घटनाओं की प्रतिशत संख्या कितनी काम हुई है ?
(iv) वर्ष 2012 में मरने वालो की संख्या किस है ?
(v) वर्ष 2012 में दुर्घटनाओं में जीवितों की संख्या क्या है ?
The correct Answer is:(i) 25:8
(ii) वर्ष 2005 में 1600 है।
(iii) 3313%
(iv) 6750
(v) 21,000
Topper's Solved these Questions
Similar Questions
सिद्ध कीजिए कि वर्ग कि एक भुजा पर बनाए गए समबाहु त्रिभुज का क्षेत्रफल उसे वर्ग के एक विकर्ण पर बनाए गए समबाहु त्रिभुज के क्षेत्रफल का आधा होता है |
06:07View SolutionWhich of the following are correct chain isomers of butane ? (i)
02:11View SolutionDetermine the point of symmetry of a regular hexagon.
02:45View SolutionMatch the following Column A to Column B
 02:17View Solution
Match the following Column A to Column B
 05:41View Solution
Match the following Column A to Column B
 02:10View Solution
The inequation represented by the graph given below is :
02:17View SolutionThe inequation that best describes the graph given below is _________
02:10View SolutionThe inequation that best describes the following graph is _________
03:12View SolutionMatch the followings (column I with column II)
ltimg src="https://d10lpgp6xz60nq.cloudfront.net/physics_images/NCERT_BIO_XI_C03_E01_011_Q01.png" width="80%"gt04:00View SolutionMatch column I with column II
ltimg src="https://d10lpgp6xz60nq.cloudfront.net/physics_images/NCERT_BIO_XI_C16_E01_002_Q01.png" width="80%"gt05:46View SolutionMatch column I with column II:
ltimg src="https://d10lpgp6xz60nq.cloudfront.net/physics_images/NCERT_BIO_XI_C18_E01_003_Q01.png" width="80%"gt06:52View SolutionMatch Column I with Column II: ltimg src="https://d10lpgp6xz60nq.cloudfront.net/physics_images/NCERT_BIO_XI_C20_E01_010_Q01.png" width="80%"gt
01:48View SolutionStudy the bar diagram and answer these questions. नीचे दिये गया बार डायग्राम का अध्ययन कीजिये तथा इस पर आधारित प्रश्नों का उत्तर दीजिये? In which year, maximum number of persons were killed in industrial accidents other than those killed in coal mines? किस वर्ष कोयले की खानों में मरने वालों को छोड़कर औद्योगिक दुर्घटनाओं में मरने वाले व्यक्तियों ,की संख्या सर्वाधिक है?
02:31View SolutionThe given Bar Graph presents the number of students of two schools for six years. दिया गया दंड आरेख छः वर्ष की अवधि में दो विद्यालयों में छात्रों की संख्या को दर्शाता है | In which year, the percentage increase in students in school B is the highest in comparison to its previous year? किस वर्ष में, विद्यालय B में छात्रों की संख्या में प्रतिशत वृद्धि इसके पिछले वर्ष की तुलना में सबसे अधिक रही है?
02:57View SolutionThe given Bar Graph presents the number of students of two schools for six years. दिया गया दंड आरेख छः वर्ष की अवधि में दो विद्यालयों में छात्रों की संख्या को दर्शाता है | In which year, the percentage increase of students in school A is the highest in comparison to its previous year? किस वर्ष, विद्यालय A में छात्रों की संख्या में प्रतिशत वृद्धि पिछले वर्ष की तुलना में सर्वाधिक है ?
03:22View Solution

