Study the bar diagram and answer these questions.
नीचे दिये गया बार डायग्राम का अध्ययन कीजिये तथा इस पर आधारित प्रश्नों का उत्तर दीजिये?
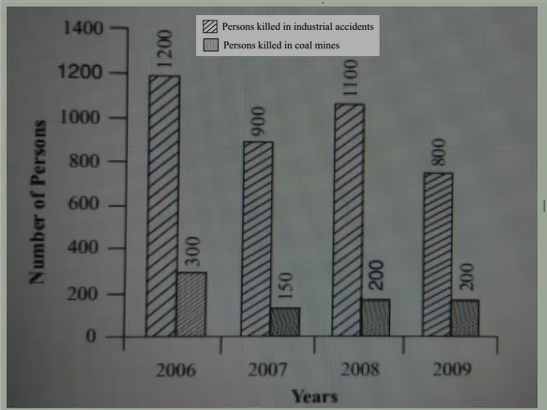
In which year, maximum number of persons were killed in industrial accidents other than those killed in coal mines?
किस वर्ष कोयले की खानों में मरने वालों को छोड़कर औद्योगिक दुर्घटनाओं में मरने वाले व्यक्तियों ,की संख्या सर्वाधिक है?
2006
2007
2008
2009
Step by step video & image solution for Study the bar diagram and answer these questions. नीचे दिये गया बार डायग्राम का अध्ययन कीजिये तथा इस पर आधारित प्रश्नों का उत्तर दीजिये? In which year, maximum number of persons were killed in industrial accidents other than those killed in coal mines? किस वर्ष कोयले की खानों में मरने वालों को छोड़कर औद्योगिक दुर्घटनाओं में मरने वाले व्यक्तियों ,की संख्या सर्वाधिक है? by Maths experts to help you in doubts & scoring excellent marks in Class 14 exams.
Updated on:21/07/2023Topper's Solved these Questions
Similar Questions
Study the bar diagram and answer these questions.
नीचे दिये गया बार डायग्राम का अध्ययन कीजिये तथा इस पर आधारित प्रश्नों का उत्तर दीजिये?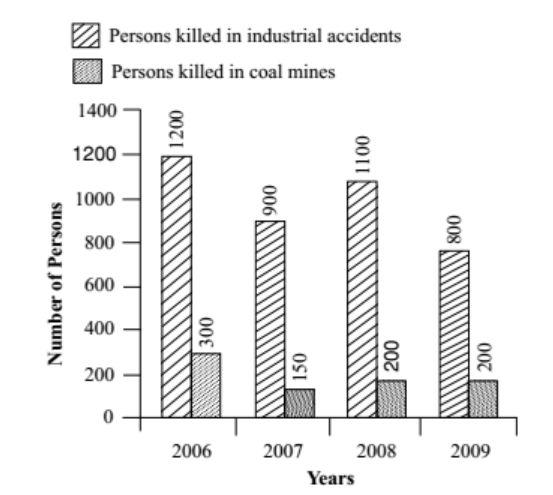
In which years, minimum number of persons were killed in coal mines other than those killed in industrial accidents?
किस वर्ष औद्योगिक दुर्घटनाओं में मरने वाले व्यक्तियों को छोड़कर कोयले की खानों में मरने वाले व्यक्तियों कौ संख्या सबसे कम थी?
View SolutionStudy the bar diagram and answer these questions.
नीचे दिये गया बार डायग्राम का अध्ययन कीजिये तथा इस पर आधारित प्रश्नों का उत्तर दीजिये?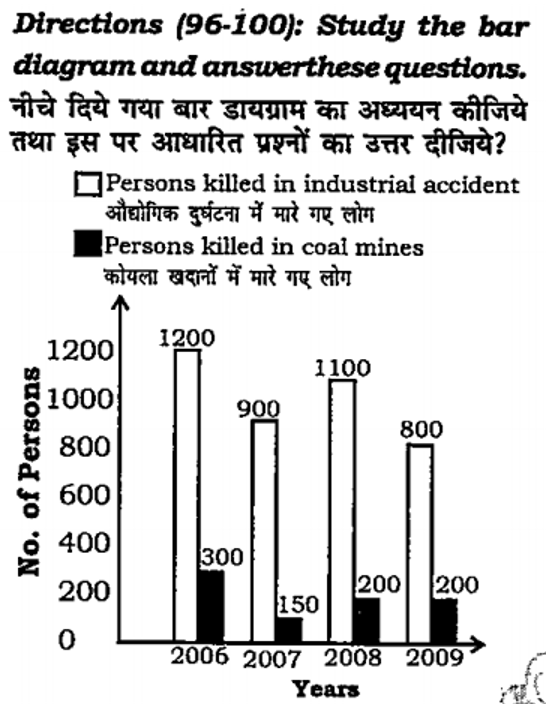
In a year, on average, how many persons. were killed in industrial accidents and coal mines together ?
औसतन, एक वर्ष में कितने व्यक्ति औद्योगिक दुर्घटनाओं तथा कोयले की खानों में कुल मिलाकर मारे गये?
View Solution
Knowledge Check
Study the following bar diagram carefully and answer the following questions :
:
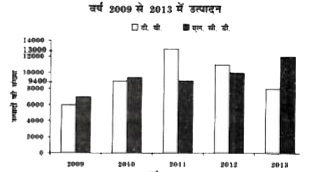
The total number of a products of electronic items is maximum in the year.A(a) 2010B(b) 2009C(c) 2011D(d) 2013
Study the graph and answer the questions.
ग्राफ का अध्ययन कीजिए और दिये गये प्रश्नों के उत्तर दीजिए:
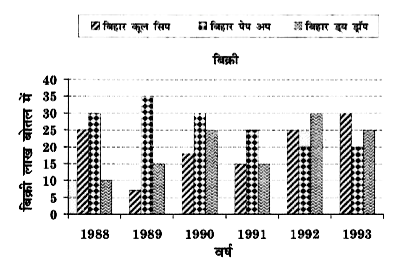
In which year sale of Dew-drop is maximum ?
ड्यू-ड्रॉप की बिक्री किस वर्ष सबसे अधिक रही?
View SolutionThe pie chart given below shows the expenditure on various items and savings of a family during the year 2009. Study the pie chart and answer these questions.
नीचे दिया गया याई-चार्ट वर्ष २००९ में एक परिवार द्वारा विभिन्न मदों पर व्यय की गई धनराशि तथा बचत को प्रदर्शित करता है। पाईं-चार्ट का अध्ययन कीजिये तथा इस पर आधारित प्रश्नों का उत्तर दीजिये-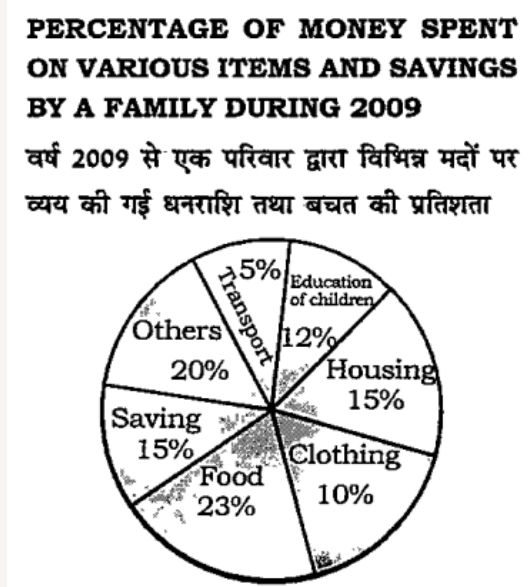 Maximum expenditure of the family other than on food, was on
परिवार द्वारा किसी मद पर भोजन के सिवाय सर्वाधिक व्यय किया गया?
View SolutionStudy the given chart carefully and answer the question accordingly:
दिए गए चार्ट का ध्यानपूर्वक अध्ययन करें और उसके अनुसार प्रश्न का उत्तर दें: In which of the following years was the percentage increase in production from the previous year, the maximum among the given years?
पिछले वर्ष की तुलना में निम्नलिखित वर्षों में से किस वर्ष में उत्पादन में अधिकतम प्रतिशत वृद्धि हुई?
View SolutionStudy the given chart and answer the following questions:
दिए गए चार्ट का अध्ययन करें और निम्नलिखित प्रश्नों के उत्तर दें: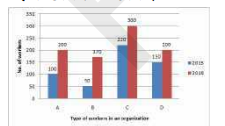 The percentage increase in the number of workers in 2018 is maximum as compared to that is
2015 in case of workers of type:
2018 में श्रमिकों की संख्या में प्रतिशत वृद्धि 2015 की तुलना में अधिकतम है, जो कि किस प्रकार के श्रमिकों के मामले में है?
View SolutionThe sub divided bar diagram given below depicts the result of class XII students of a school for three years. Study the diagram and answer the questions given below.
निम्नलिखित दण्ड आरेख तीन वर्षों के लिए एक स्कूल के कक्षा XII के छात्रों का परीक्षा परिणाम दिखाता है। दण्ड आरेख का अध्ययन कीजिए और निम्नलिखित प्रश्नों का उत्तर दीजिए :
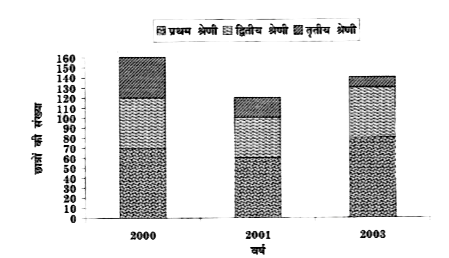
The number of students passed with Second class in the year 2002 is.
वर्ष 2002 में द्वितीय श्रेणी में उत्तीर्ण छात्रों की संख्या है
View SolutionThe given bar graph shows the biscuit exports of India over a period of five years. Study the graph and answer the question that follows.
दिया गया दंड आरेख में पांच साल की अवधि में भारत के बिस्किट निर्यात को दर्शाता है। आरेख का अध्ययन करें और उस प्रश्न का उत्तर दें जो पूछा गया है। In which year, the percentage increase in exports was maximum from its preceding year:
किस वर्ष में निर्यात में प्रतिशत वृद्धि इसके पूर्व वर्ष से अधिकतम थी?
View SolutionThe given pie chart shows the percentage distribution of 450 employees in an organization. Study the pie chart and answer the questions that follow
दिए गए पाई चार्ट एक संगठन में 450 कर्मचारियों के प्रतिशत को दर्शाता है। पाई चार्ट का अध्ययन करें और आने वाले प्रश्नों का उत्तर दें।
What is the central angle of the sector representing the number of employees in department A?
विभाग A में कर्मचारियों की संख्या का प्रतिनिधित्व करने वाले क्षेत्र का केंद्रीय कोण क्या है?
View Solution
