Which plot is the adsorption isobar for chemisorption?
A
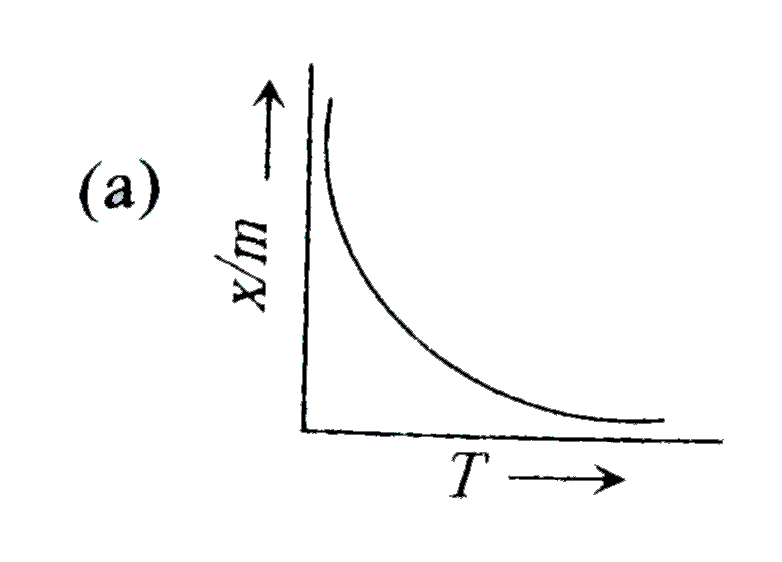
B
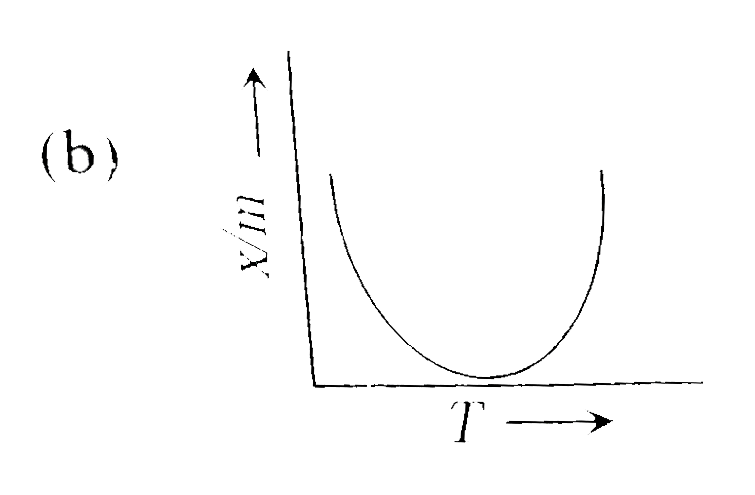
C
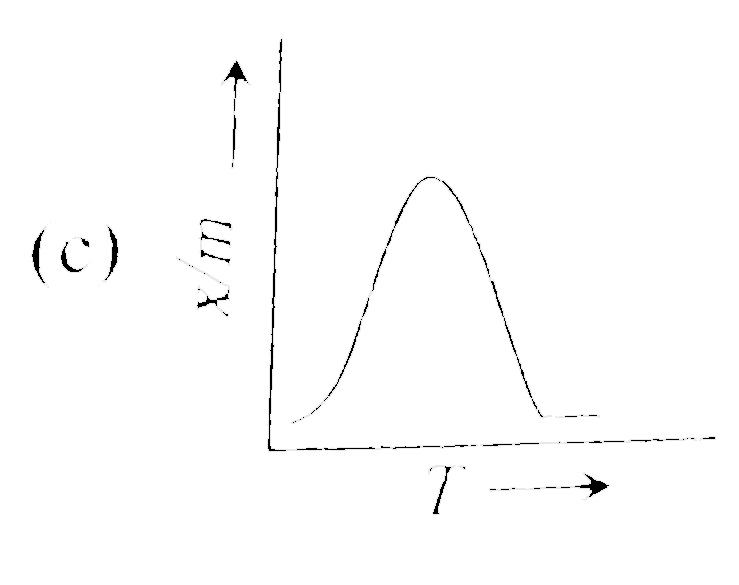
D
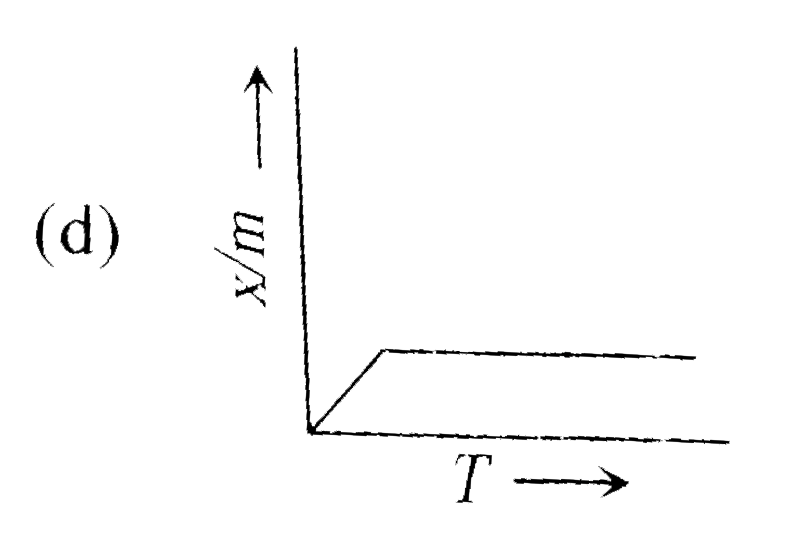
Video Solution
Text Solution
The correct Answer is:C
Chemical adsorption first increases, then decreasesto attain constancy with rise in temperature.
|
Topper's Solved these Questions
- SURFACE CHEMISTRYBook:ERRORLESS Chapter:SURFACE CHEMISTRYExercise:JEE Section (Reasoning question)
Explore 4 Videos
- SURFACE CHEMISTRYBook:ERRORLESS Chapter:SURFACE CHEMISTRYExercise:JEE Section (Passage-I)
Explore 2 Videos
- SURFACE CHEMISTRYBook:ERRORLESS Chapter:SURFACE CHEMISTRYExercise:Critical Thinking Objective Question
Explore 22 Videos
- ATOMIC STRUCTUREBook:ERRORLESS Chapter:ATOMIC STRUCTUREExercise:JEE SECTION (Matrix Match Type Questions)
Explore 1 Video
Similar Questions
Knowledge Check
Which plot is the adsorptoion isobar for chemisorption where m (at constant pressure ) at temperature T ?
A (##DPB_PHY_CHM_IX_C13_E01_018_O01.png" width="30%">.B (##DPB_PHY_CHM_IX_C13_E01_018_O02.png" width="30%">.C (##DPB_PHY_CHM_IX_C13_E01_018_O03.png" width="30%">.D (##DPB_PHY_CHM_IX_C13_E01_018_O04.png" width="30%">Which of the plots is adsorption isobar for chemisorption?
A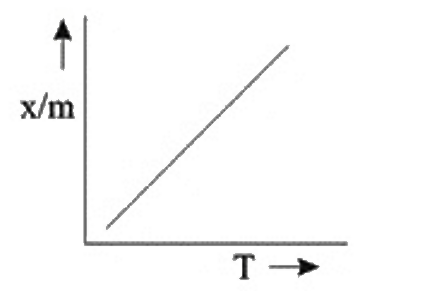 B
B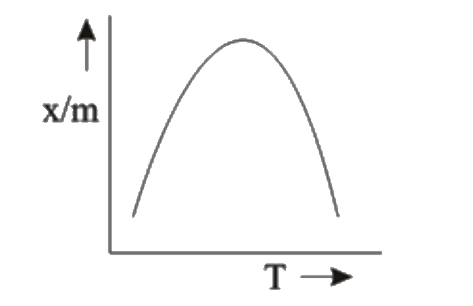 C
C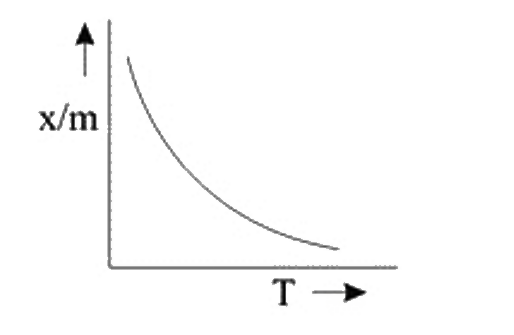 D
D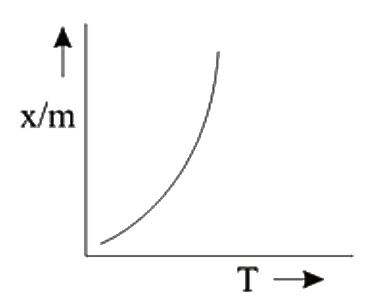
Which is not adsorption isobar for chemisorption?
A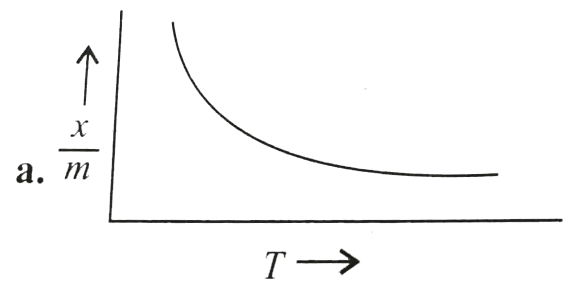 B
B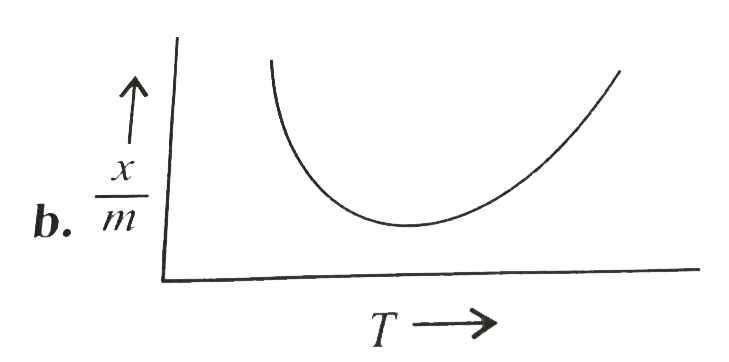 C
C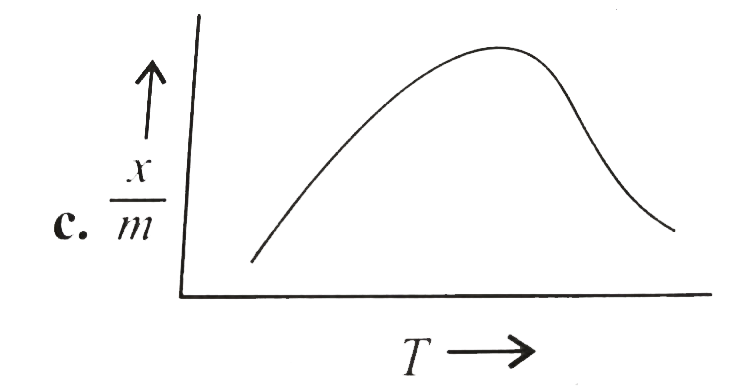 D
D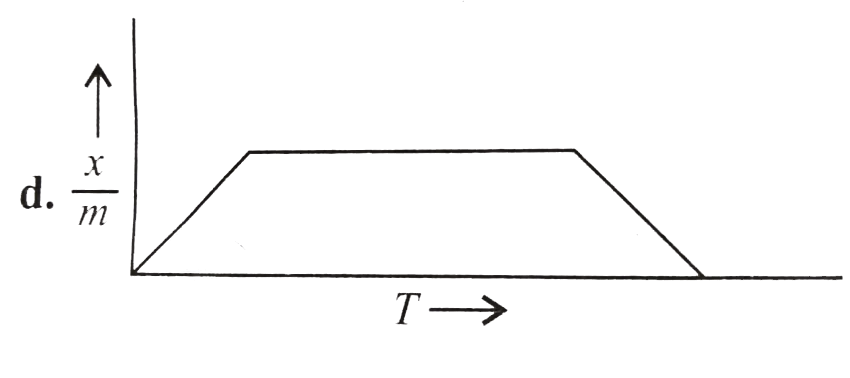
Of physisorption and chemisorption which type of adsorption has a higher enthalphy of adsorption ?
View Solutionselect correct absorption isobars for chemisoption and physisoption respectivly ,
(where xm = extent of adsorption , T = temperature )
View SolutionSelect correct adsorption isobars for chemisorption and physisrption respectively (where xm = extent of adsorption , T = temperature )
View SolutionSelect correct adsorption isobars for chemisorption and physisorption respectively :
(where xm= extent of adorption, T= temperature )
View Solutionselect correct absorption isobars for chemisorption and physisorption respectively ,
(where xm = extent of adsorption , T = temperature )
View Solution