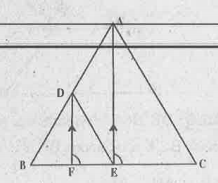
క్రింది పటంలో DE // BC మరియు BD = 7.2 సెంమీ, AC = 7.2 సెంమీ, EC=5.4 సెంమీ, అయిన AD = ?

2 సెంమీ
2.4 సెంమీ
3 సెంమీ
3.6 సెంమీ
Step by step video & image solution for క్రింది పటంలో DE // BC మరియు BD = 7.2 సెంమీ, AC = 7.2 సెంమీ, EC=5.4 సెంమీ, అయిన AD = ? by Maths experts to help you in doubts & scoring excellent marks in Class 10 exams.
Updated on:21/07/2023Topper's Solved these Questions
- సరూప త్రిభుజాలుBOOK - VGS PUBLICATION-BRILLIANT(TELUGU)CHAPTER - సరూప త్రిభుజాలుEXERCISE - Exercise
211 Videos
- సమితులుBOOK - VGS PUBLICATION-BRILLIANT(TELUGU)CHAPTER - సమితులుEXERCISE - Exercise
298 Videos
- సాంఖ్యకశాస్తంBOOK - VGS PUBLICATION-BRILLIANT(TELUGU)CHAPTER - సాంఖ్యకశాస్తంEXERCISE - Exercise
147 Videos
Similar Questions
ఇచ్చిన పటంలో, DE∣∣AC మరియు DF∣∣AE అయిన BF /FE = BE/ EC అని చూపండి.

View Solutionక్రింది వాటిలో ఏవి సమితులు? మీ సమాధానాన్ని సహేతుకంగా సమర్థించండి. "J" అనే అక్షరంతో ప్రారంభమయ్యే ఒక సంవత్సరంలో గల అన్నీ నెలల సమూహాలు.
View Solutionఒక' గ్రామంలో కొంతమంది విద్యార్థుల జట్టు “పర్యావరణ పరిరక్షణ - అవగాహని అనే కార్యక్రమంలో భాగంగా, 20 ఇండ్లలో సర్వే నిర్వహించి, ఎన్నెన్ని మొక్కలు నాటినారో సమాచారాన్ని సేకరించి, ఈ క్రింది పట్టికలో నమోదు చేసినారు. సగటున ఒక ఇంటికి ఎన్ని మొక్కలు నాటినారో కనుక్కోండి.

View SolutionHow many lines of symmetry does the above figure have ?
View SolutionWhich of the following are correct chain isomers of butane ? (i)
View SolutionDetermine the point of symmetry of a regular hexagon.
View SolutionDtermine the images of the following figure about the given line :
View SolutionIn the figure above (not to scale), ¯¯¯¯¯¯AB⊥¯¯¯¯¯¯CDandAD is the bisector of ∠BAE.AB=3cm and AC=5cm. Find CD.
View SolutionMatch the following Column A to Column B

View SolutionMatch the following Column A to Column B

View SolutionMatch the following Column A to Column B

View SolutionFind the area of the figure given below.

View SolutionThe inequation represented by the graph given below is :
View SolutionThe inequation that best describes the graph given below is _________
View SolutionThe inequation that best describes the following graph is _________
View Solution
