The change in volume of a gas with change in temperature is plotted on a graph, as shown in he figure. Calculate the ratio of density at 50∘Cand100∘C
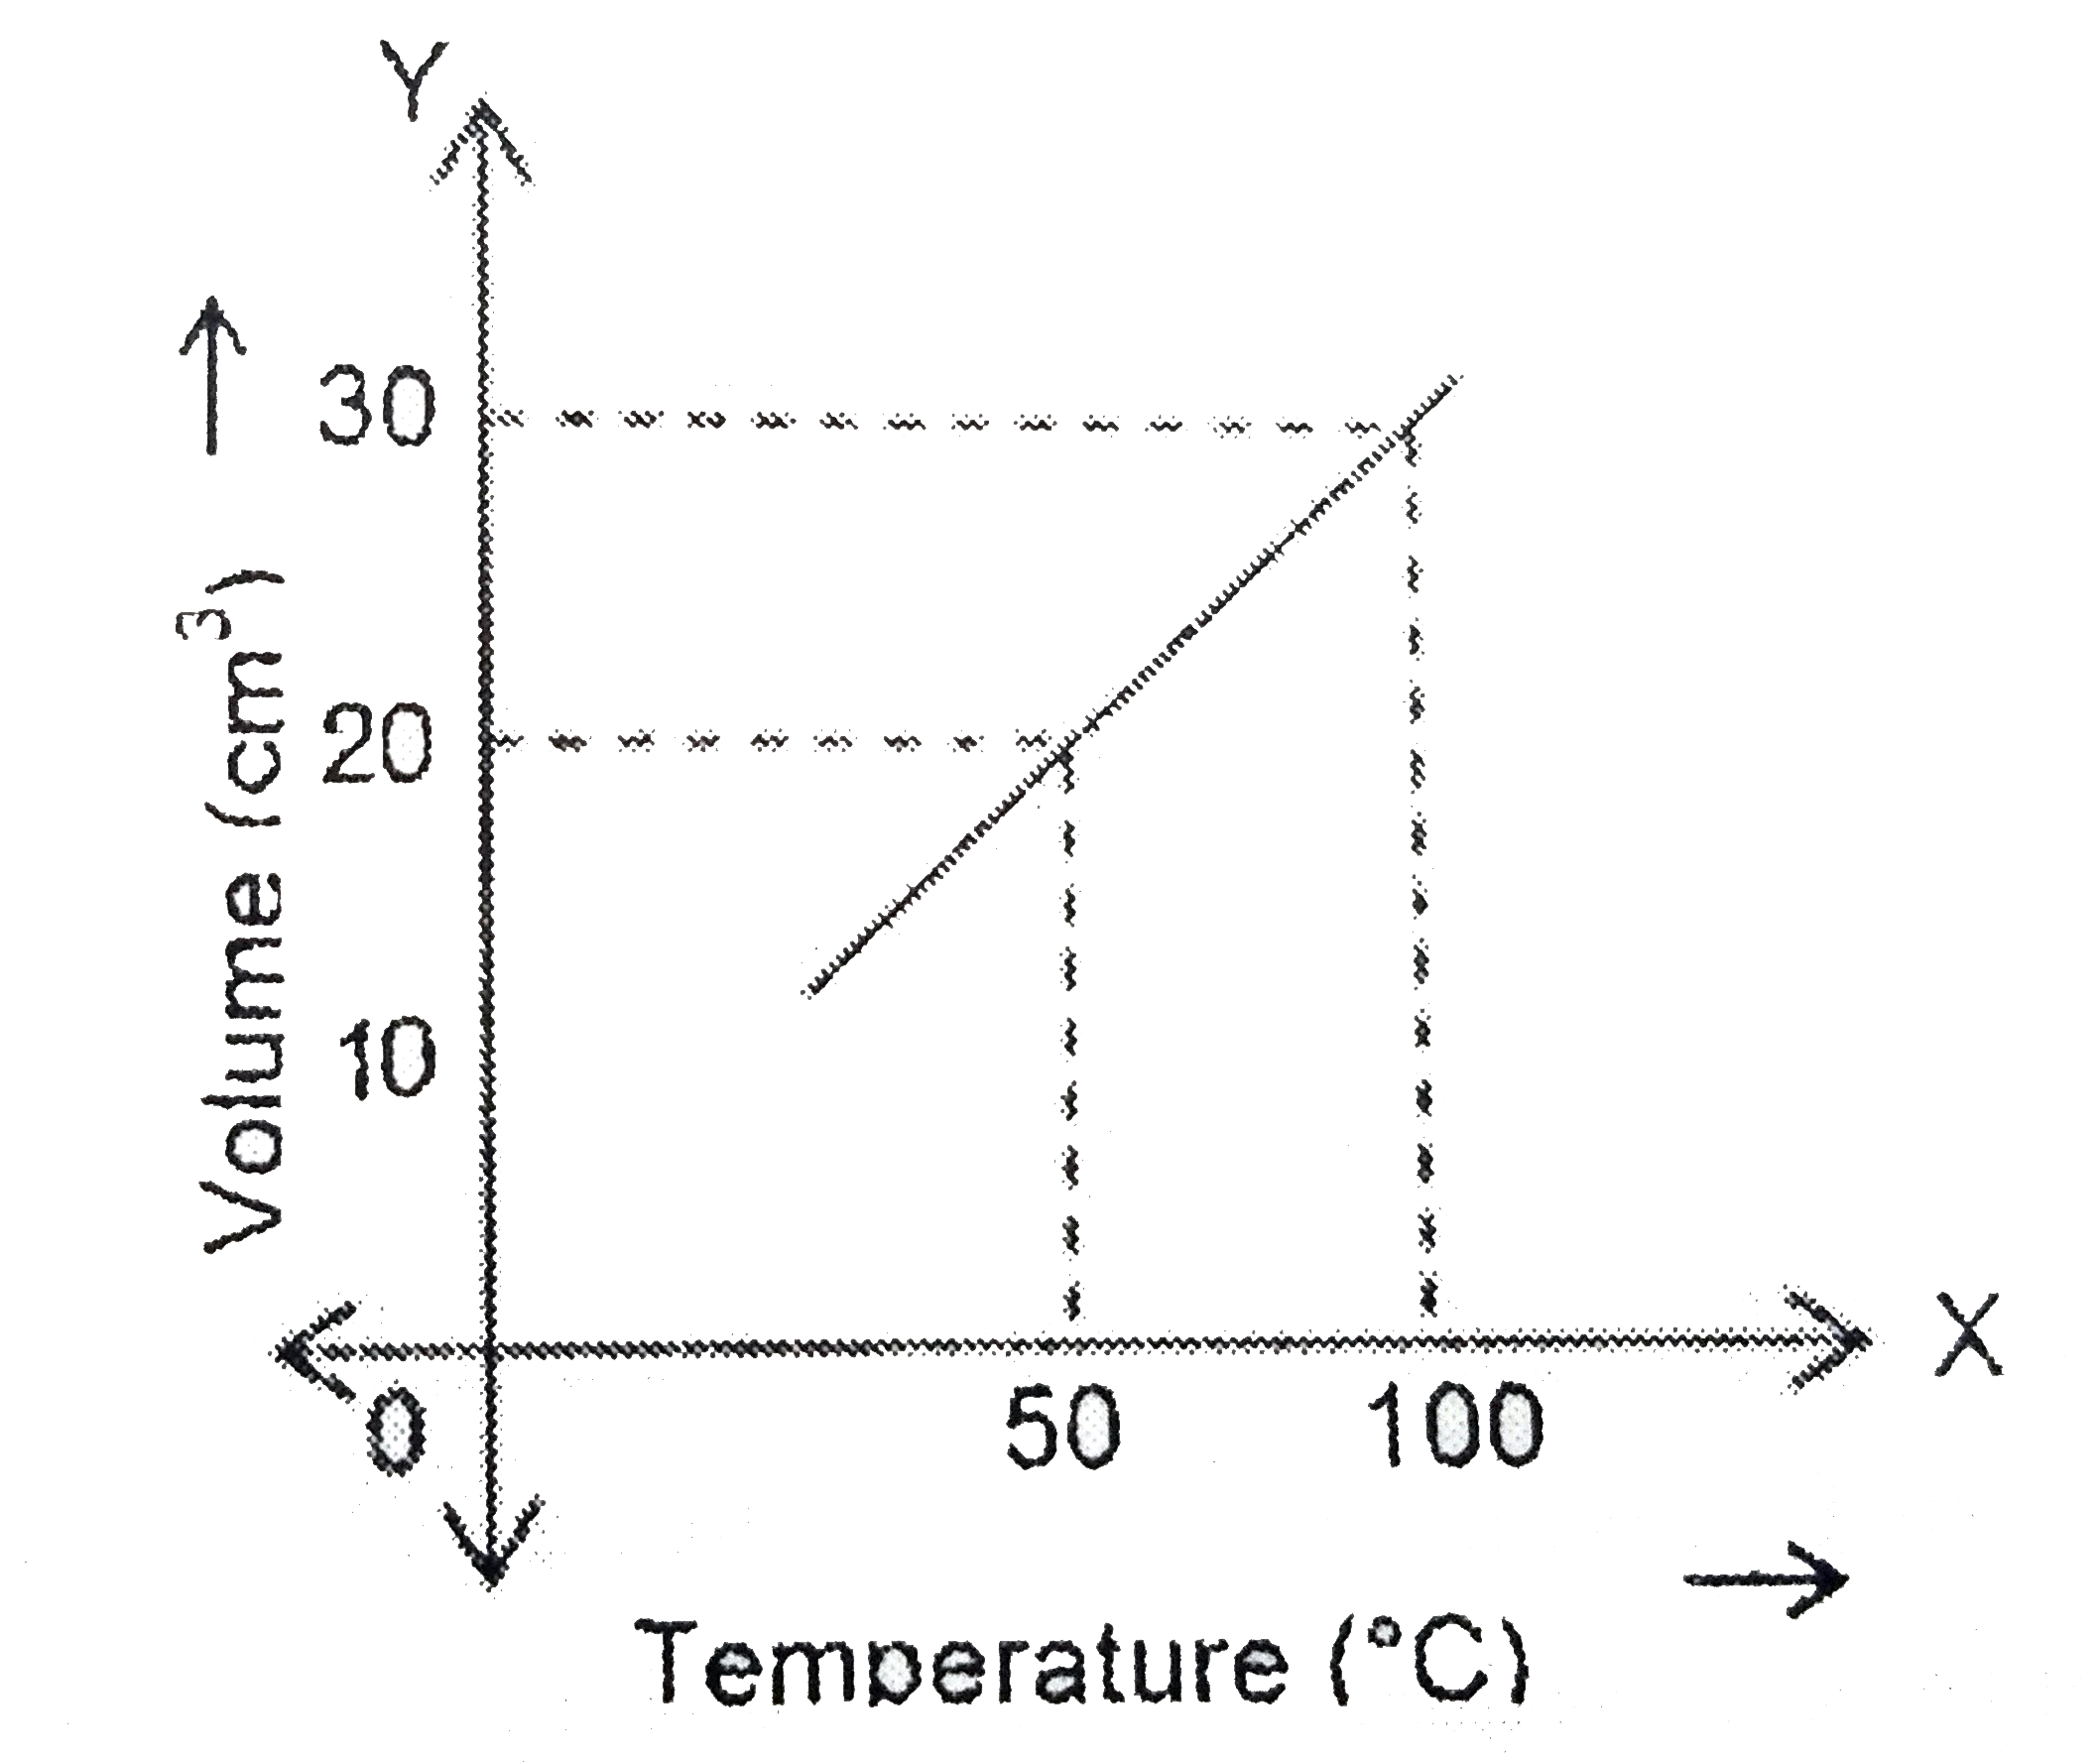
Volume at 50∘C=20 cm3
Volume at 100∘C=30 cm3
Density = "mass"/"volume"
Ratio of density 3020=32=3:2
Topper's Solved these Questions
- BOOK - PEARSON IIT JEE FOUNDATIONCHAPTER - MEASUREMENTSEXERCISE - Level 310videos
MEASUREMENTS
- BOOK - PEARSON IIT JEE FOUNDATIONCHAPTER - MEASUREMENTSEXERCISE - Test 130videos
MEASUREMENTS
- BOOK - PEARSON IIT JEE FOUNDATIONCHAPTER - MEASUREMENTSEXERCISE - Level 1 (MCQs)48videos
MEASUREMENTS
- BOOK - PEARSON IIT JEE FOUNDATIONCHAPTER - MACHINES AND TOOLSEXERCISE - CONCEPT APPLICATION (LEVEL 2)12videos
MACHINES AND TOOLS
- BOOK - PEARSON IIT JEE FOUNDATIONCHAPTER - MOCK TESTEXERCISE - MULTIPLE CHOICE QUESTION25videos
MOCK TEST
Similar Questions
The change in volume of a gas with change in temperature is plotted on a graph, as shown in he figure. Calculate the ratio of density at 50∘Cand100∘C
 View Solution
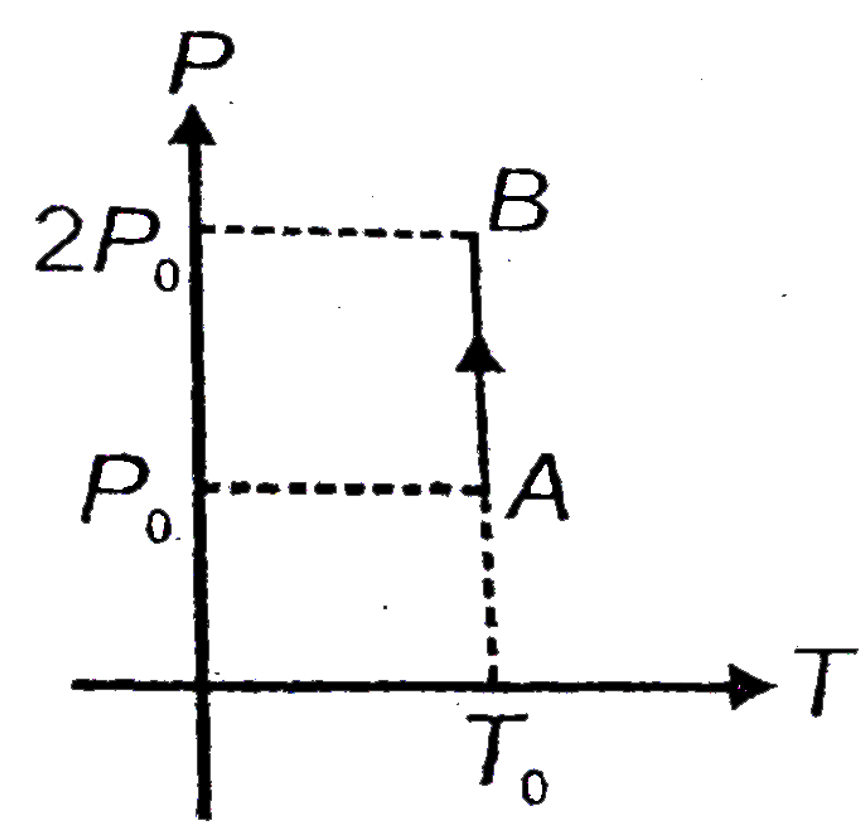
For a given mass of gas the variation of pressure versus temperature is shown in the figure. What is the ratio of volume of the gas at points A and B.
 .View Solution
Knowledge Check
- Question 1 - Select One
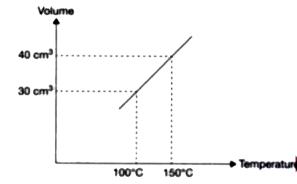
The change in volume of a given mass of gas with the temperature is graphically represented as shown in the figure shown below. Determine the ratio of densities of the gas at 100∘Cand150∘C.
 A43B34C35D13
 - Question 2 - Select One
At what temperature, the r.m.s. velocity of a gas measured at 50∘C will become double ?
A626 KB1019KC200∘CD1019∘C - Question 3 - Select One
The change in temperature of a body is 50∘C . The change on the Kelvin scale is
A50KB323KC70KD30K
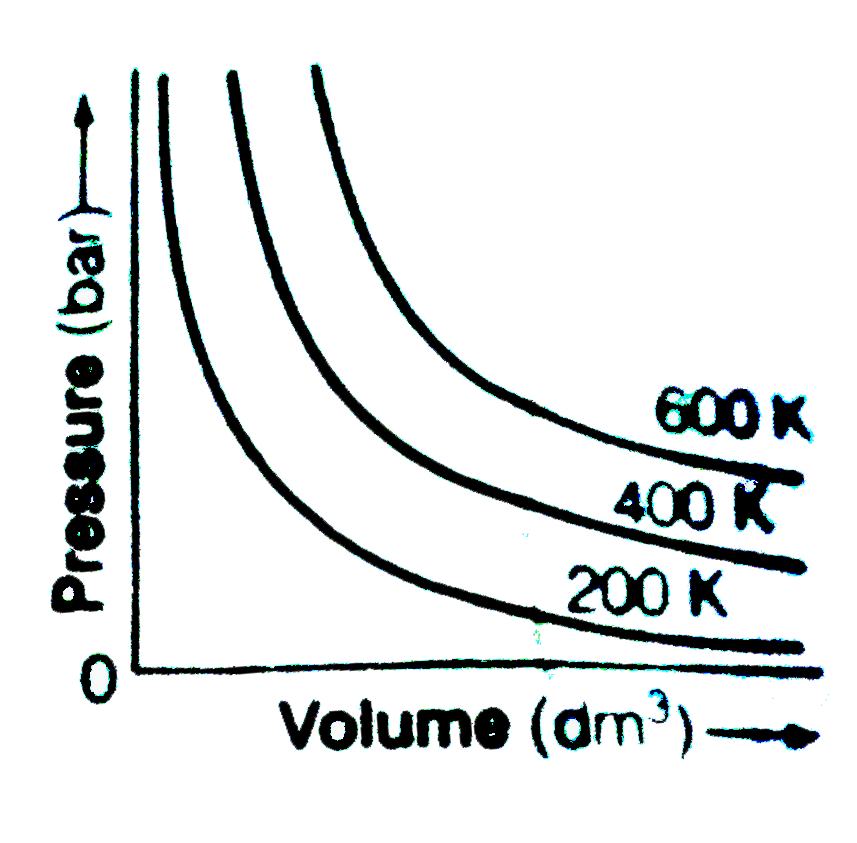
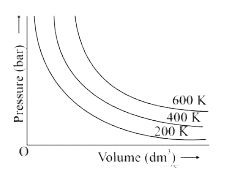
The variation of pressure with volume of the gas at different temperatures can be graphically represented as shown in figure. On the basis of this graph answer the following question.
(i) How will the volume of a gas change if its pressure is increased at constant temperature ?
(ii) At a constant pressure, how will the volume of a gas change if the temperature is increased from 200 K to 400 K ?
 View Solution
The variation of pressure with volume of the gas at different temperatures can be graphically represented as shown in figure. On the basis of this graph answer the following questions.
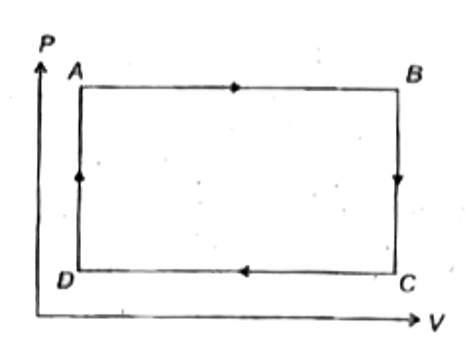
How will the volume of a gas change if its pressure is increased at constant temperature?View SolutionThe pressure and volume of a gas changed as shown in the P-V diagram in this figure. The temperature of the gas will
 View Solution
The variation of pressure with volume of the gas at different temperatures can be graphically represented as shown in figure. On the basis of this graph answer the following questions.
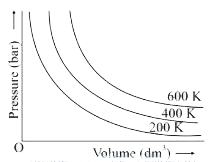
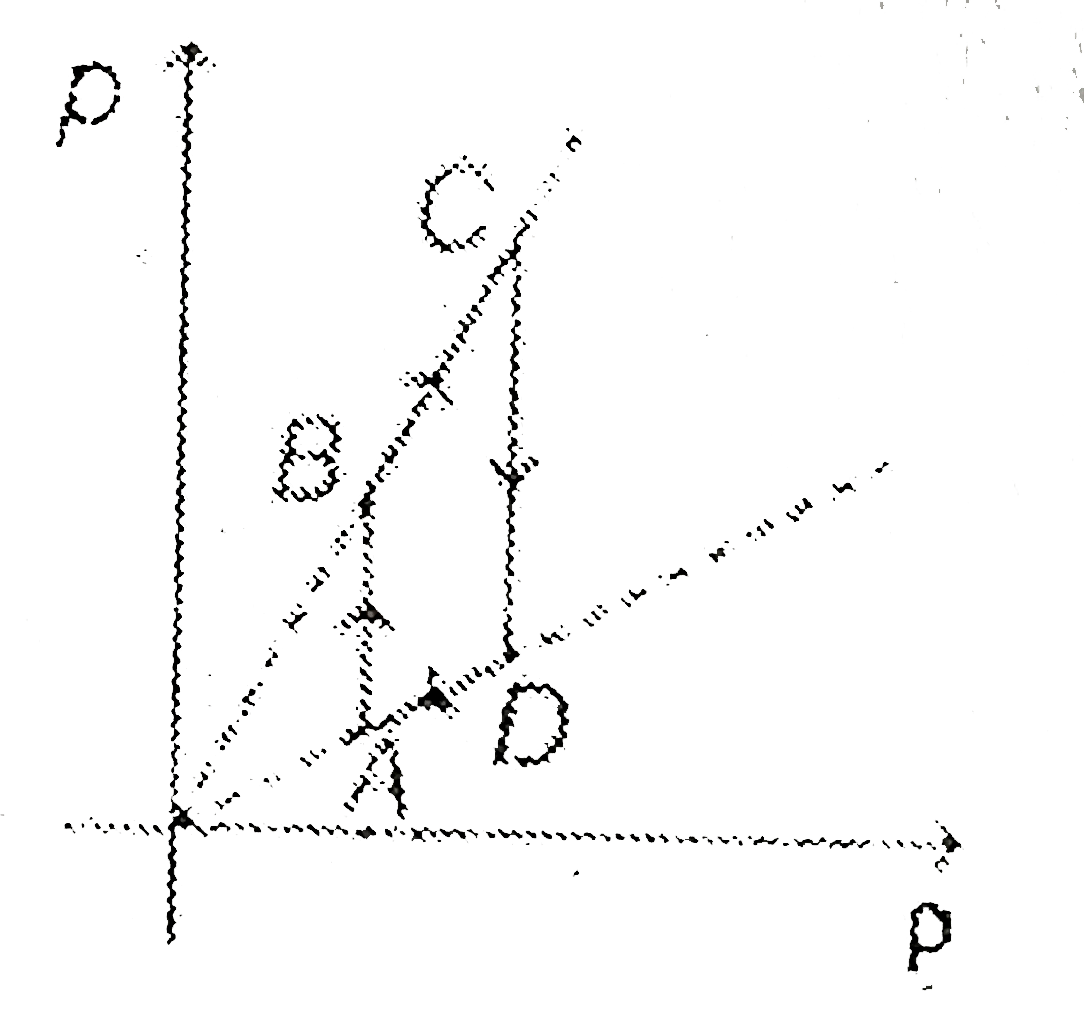
At a constant pressure, how will the volume of a gas change if the temperature is increased from 200 K to 400 K?View SolutionPressure versus density graph of an ideal gas is shown in figure
 View Solution
