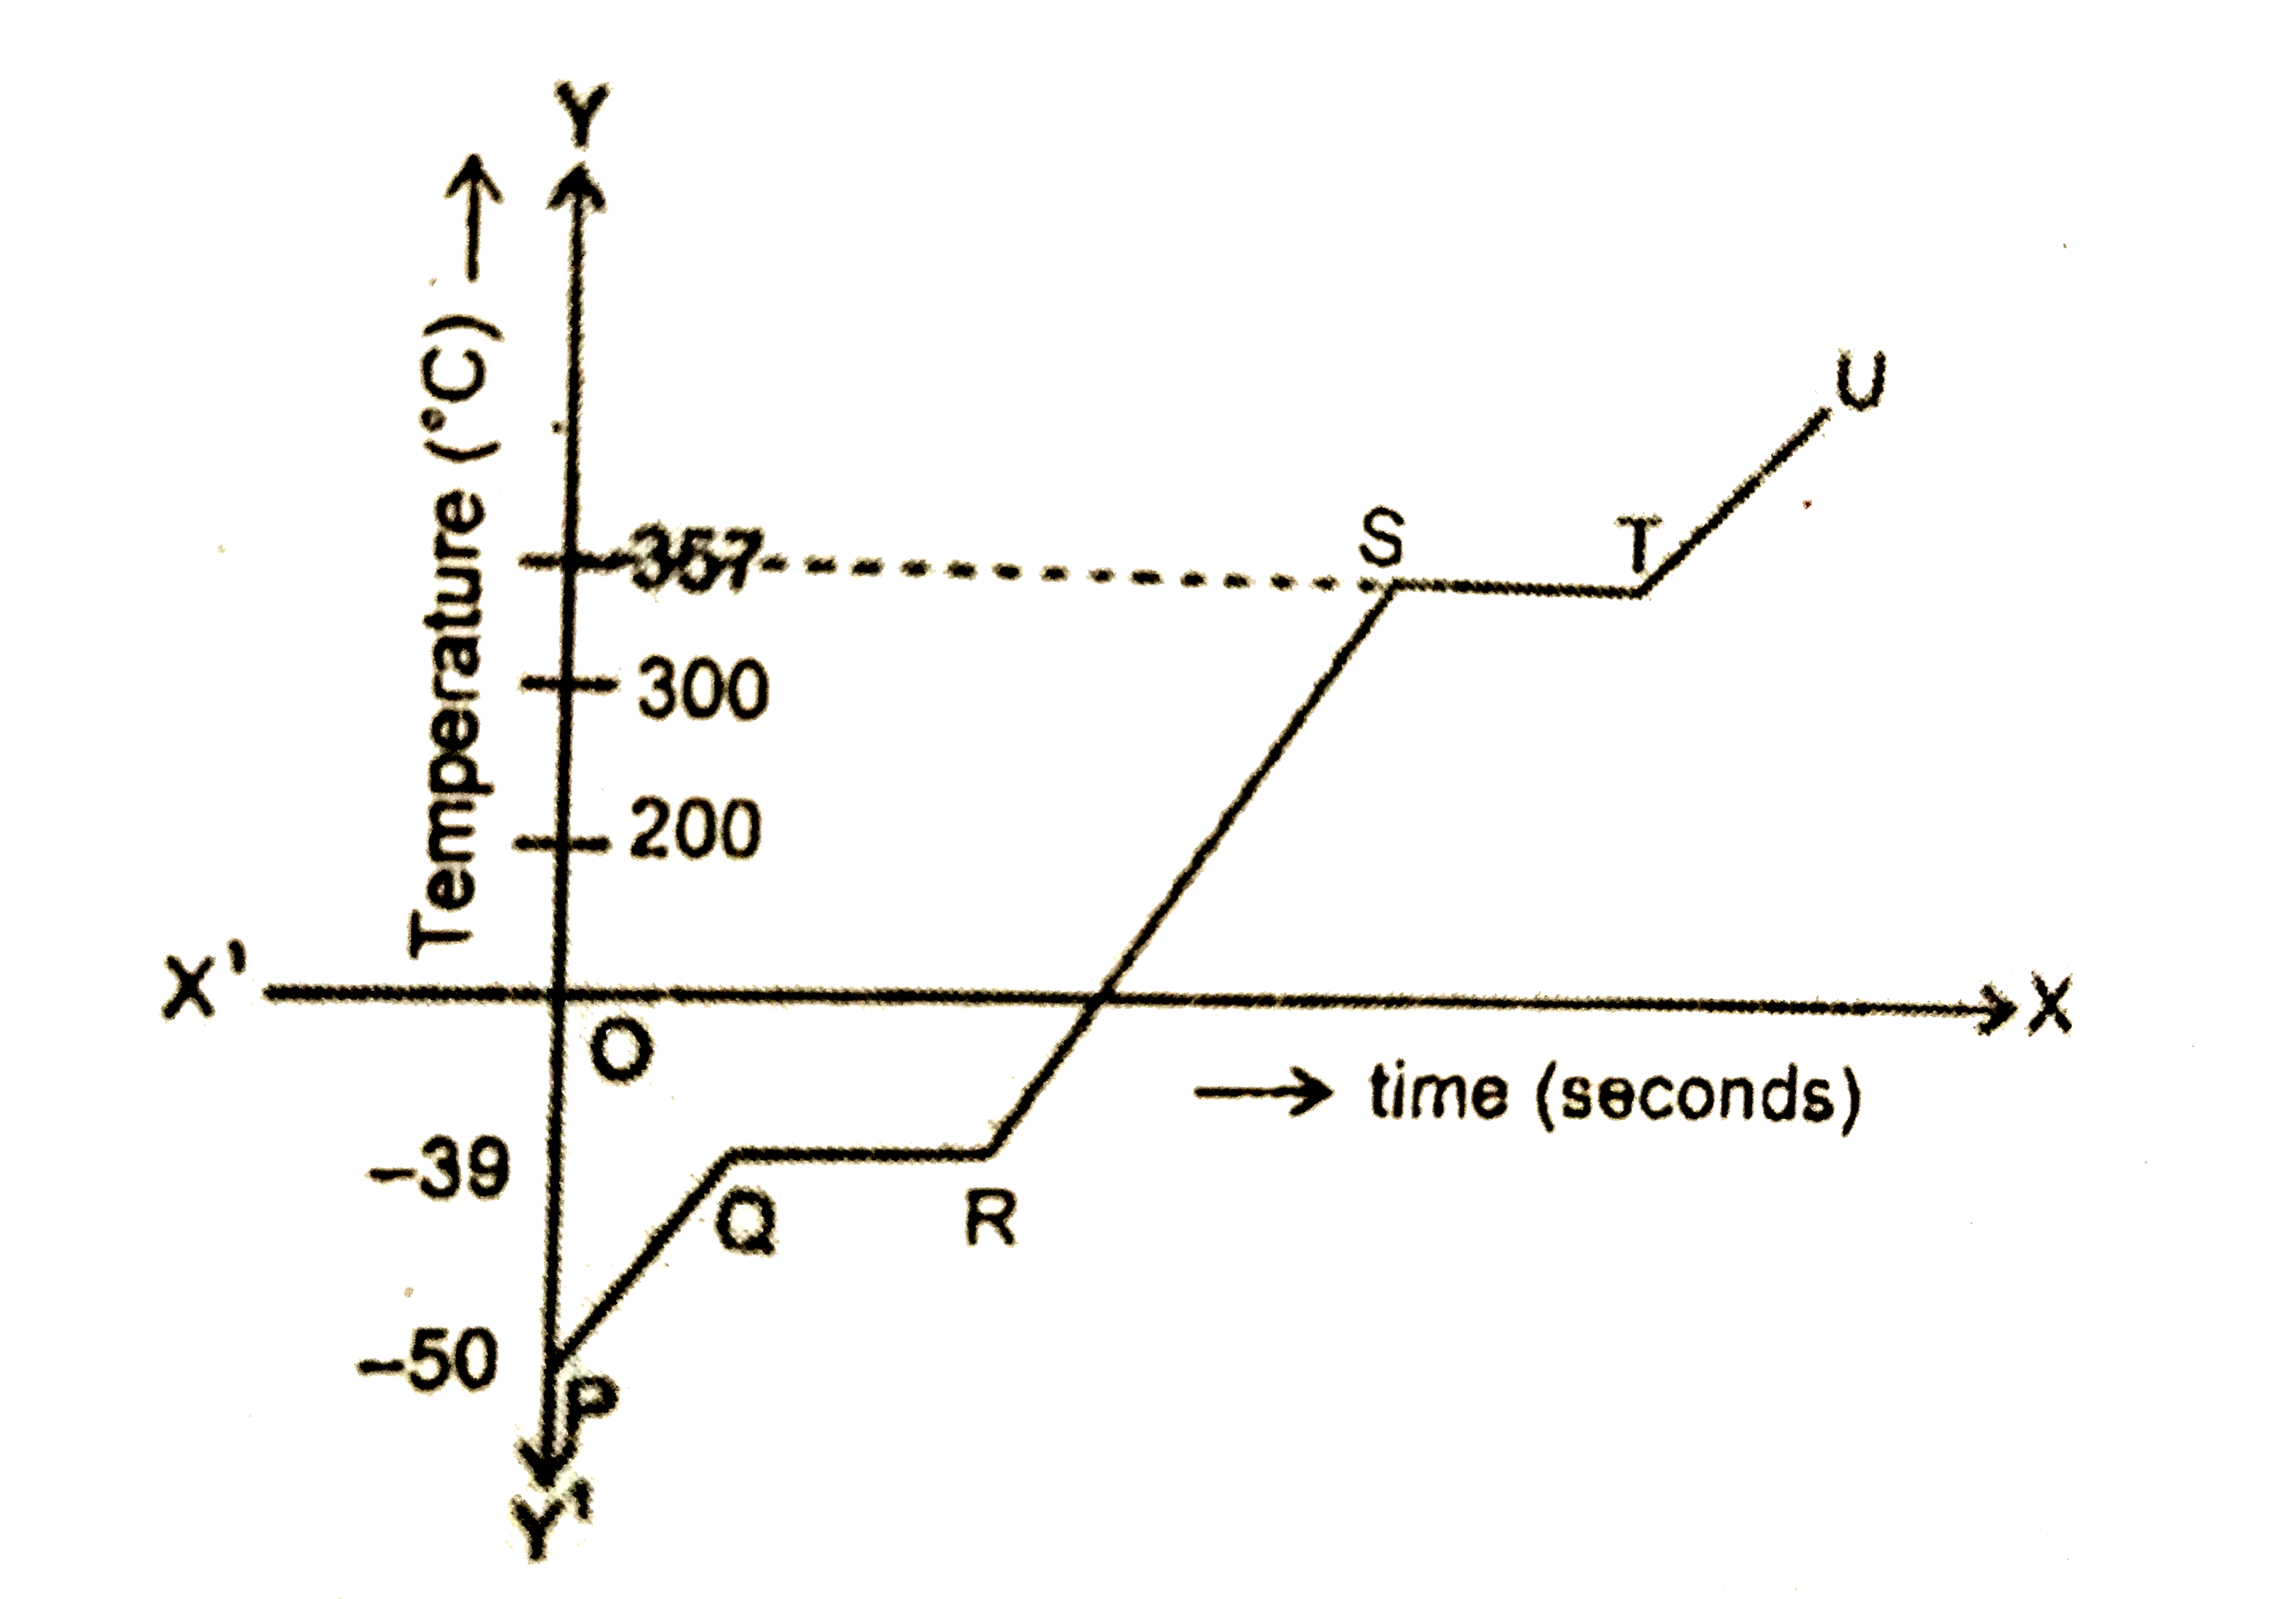
RS part of the graph indicates _________ state of substance
solid
liquid
gaseous
cannot be determined
The correct Answer is:b
The substacne in solid state from ot and it changes its state at i.e convert into liquid state .Therefore it will be in liquid state from to hence RS part of the graph indicates liquid state
Topper's Solved these Questions
- BOOK - PEARSON IIT JEE FOUNDATIONCHAPTER - HEAT EXERCISE - Test 115videos
HEAT
- BOOK - PEARSON IIT JEE FOUNDATIONCHAPTER - ElectricityEXERCISE - ASSESSMENT TEST (TEST-2)15videos
Electricity
- BOOK - PEARSON IIT JEE FOUNDATIONCHAPTER - KINEMATICSEXERCISE - ASSESSMENT TEST (TEST 2 (SELECT THE CORRECT ALTERNATIVE)15videos
KINEMATICS
Similar Questions

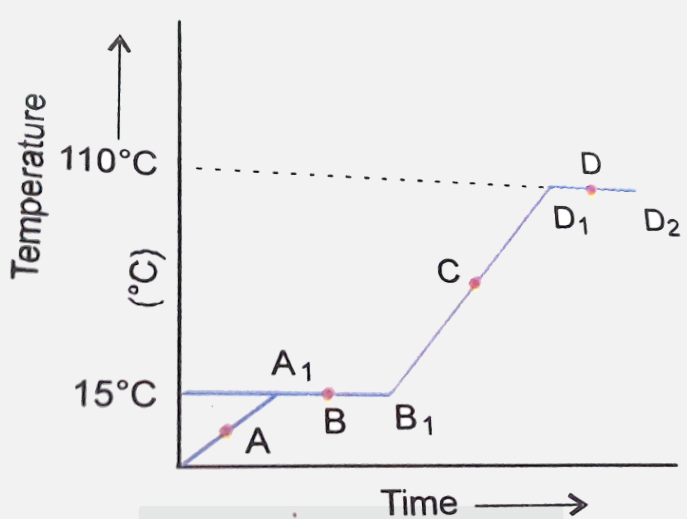
This graph indicates:View SolutionThe temperature-time graph below shows the heating curve for pure wax. From the graph answer the following :
(a) What is the physical state of the substance at the points A, B, C and D ?
(b) What is the melting point of the substance ?
(c ) What is its boiling point ?
(d) Which portions of the graph indicates that change of state is taking place.
(e ) Name the terms used for heat absorbed during change of states involved in above processes.
 View Solution
Knowledge Check
- Question 1 - Select One
The heating curve of a particular substance in solid state is as shown in the figure: Choose the correct alternative.
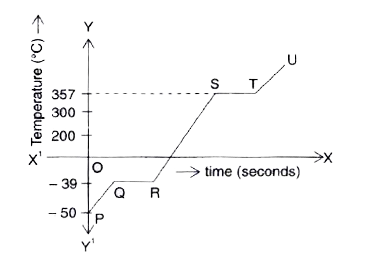
The portion RS of the graph indicates _____ state of substance.AsolidBliquidCgaseousDCannot be determined - Question 2 - Select One
The given graph indicates :
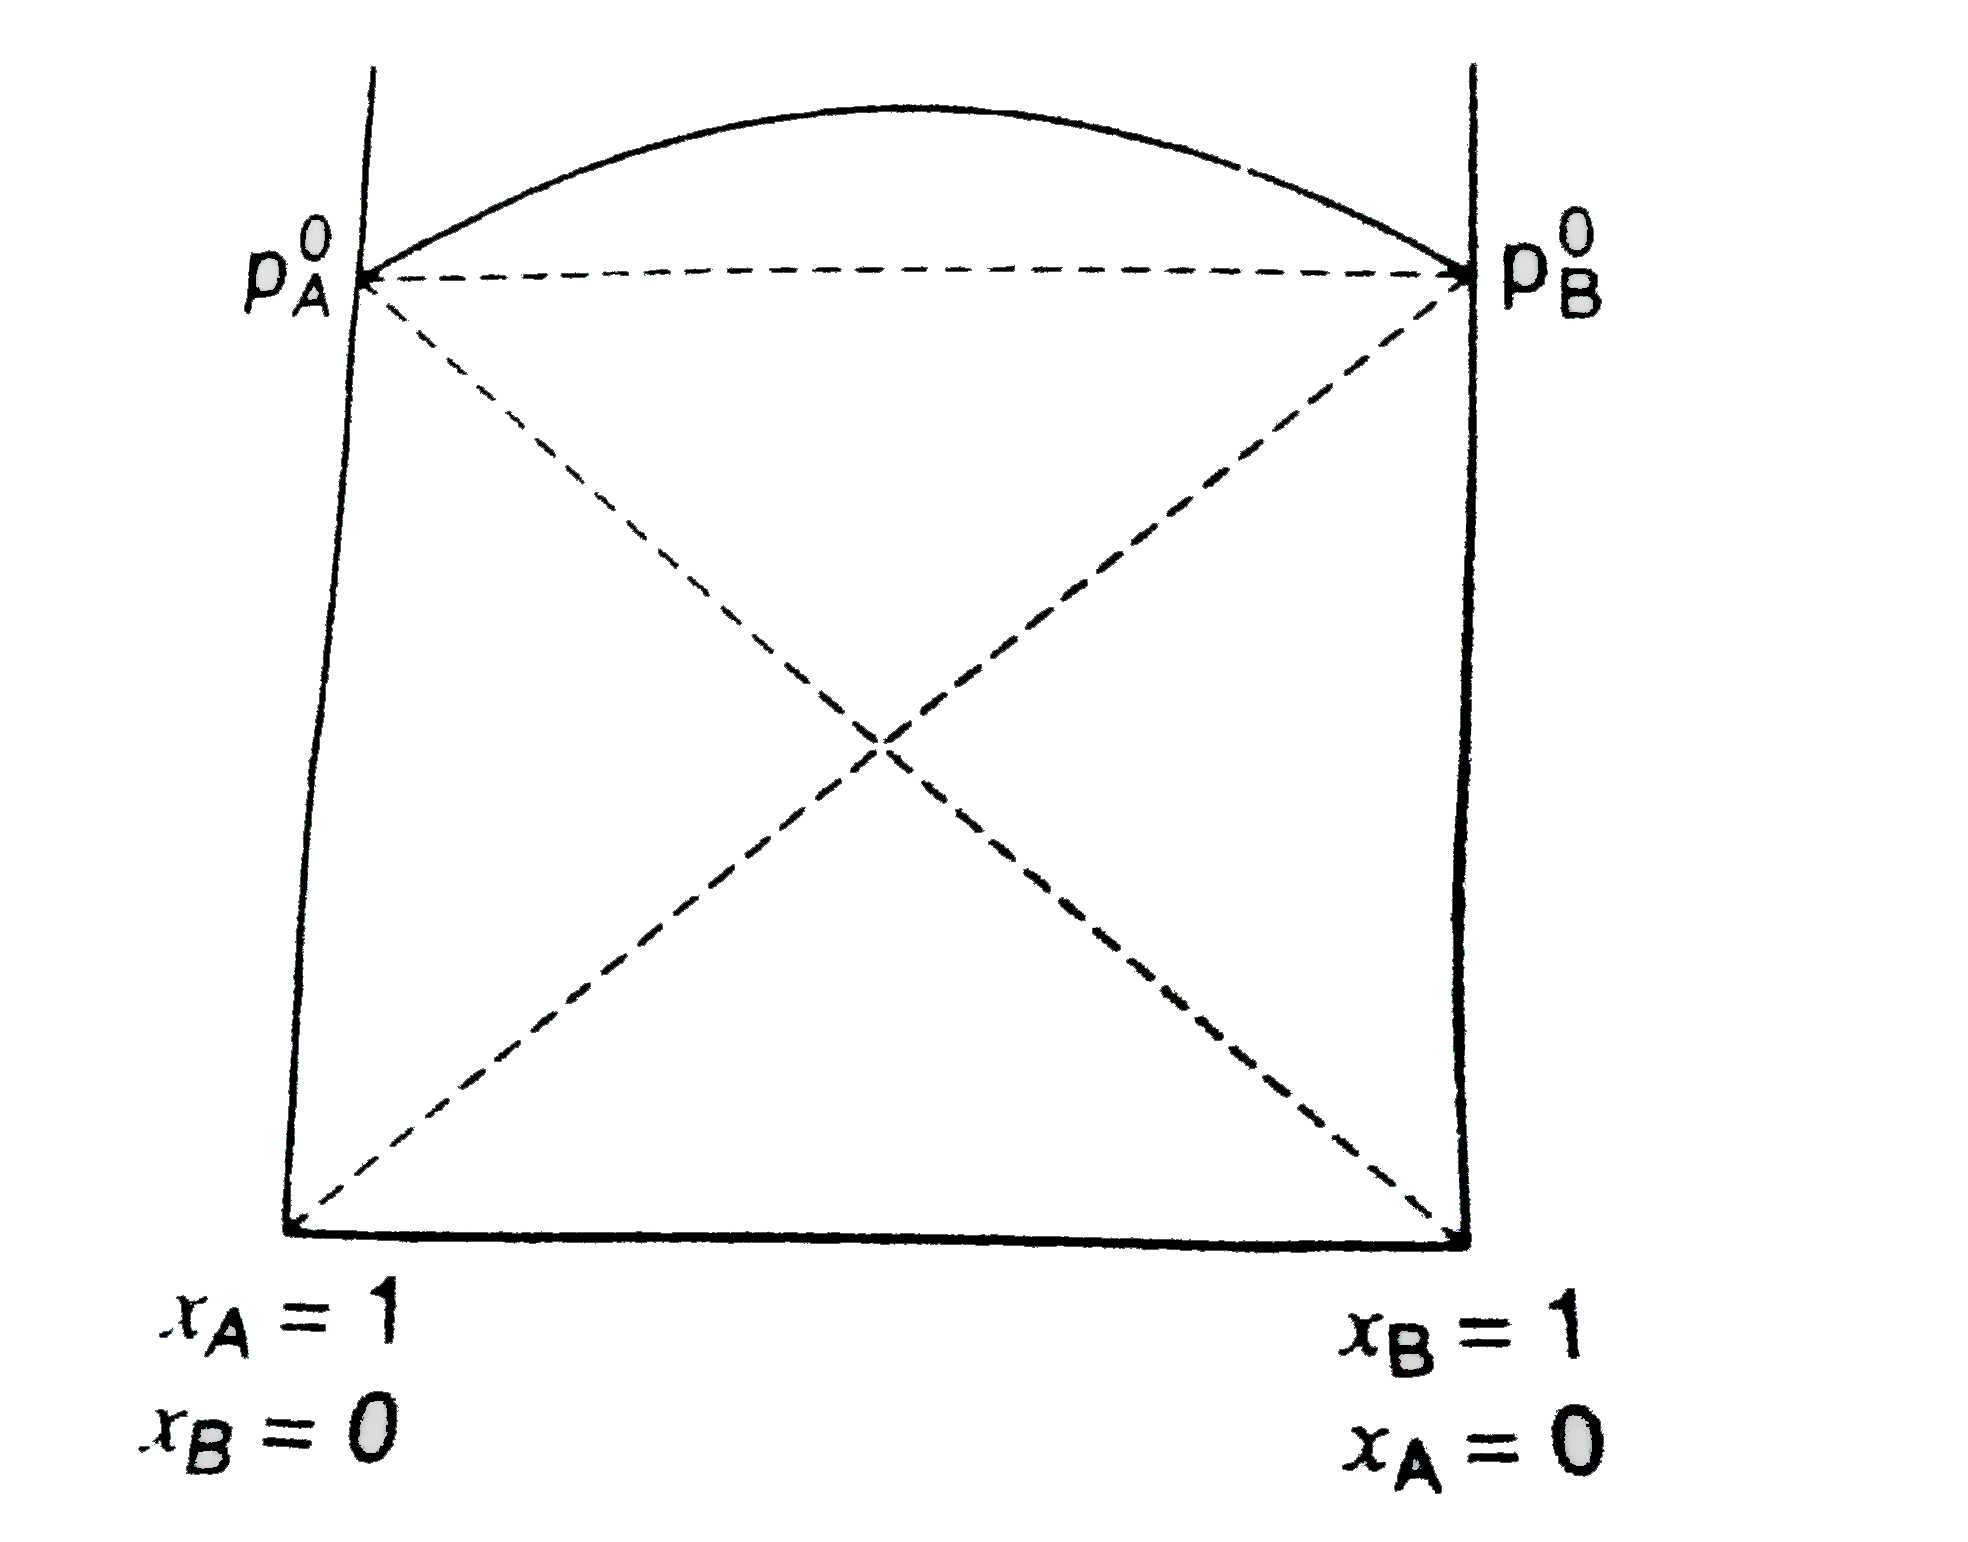 A(+) deviationB(-) deviationCno deviationDnone of these
 - Question 3 - Select One
Standard state of a gaseous substance indicates that the substance is at
A1 atmospherie pressure and 1∘C temperatureB1 atmospheric pressure and 0∘C temperatureC1 atmospheric pressure and 298 K temperatureD1 atmospheric pressure and 0 K temperature
Define gaseous state of a substance.
View SolutionIn writing thermochemical equations, why is it important to indicate the physical state of each substance?
View Solution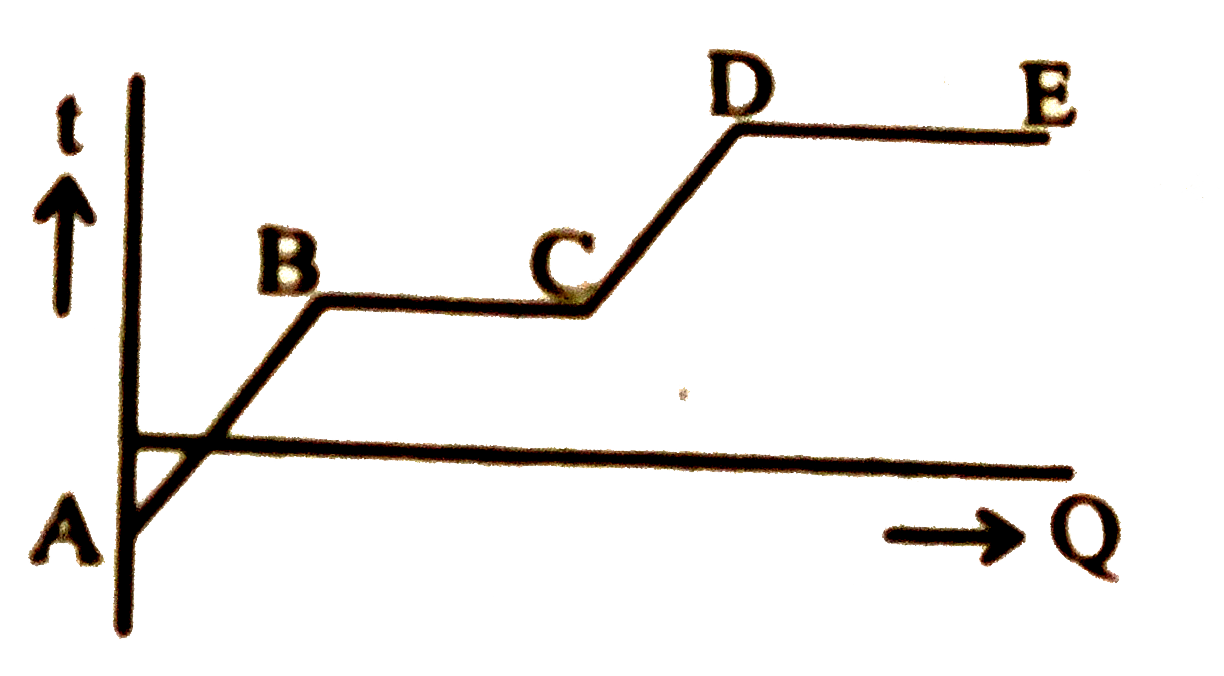
The graph given above indicates change in temperature (Δt) when heat (Q) was given to a substance. Which among the following parts of the graph correctly depict the latent heat of the substance?View SolutionThe physical state of a substance can be changed by
View SolutionThe physical state of a substance can be changed by
View Solution

