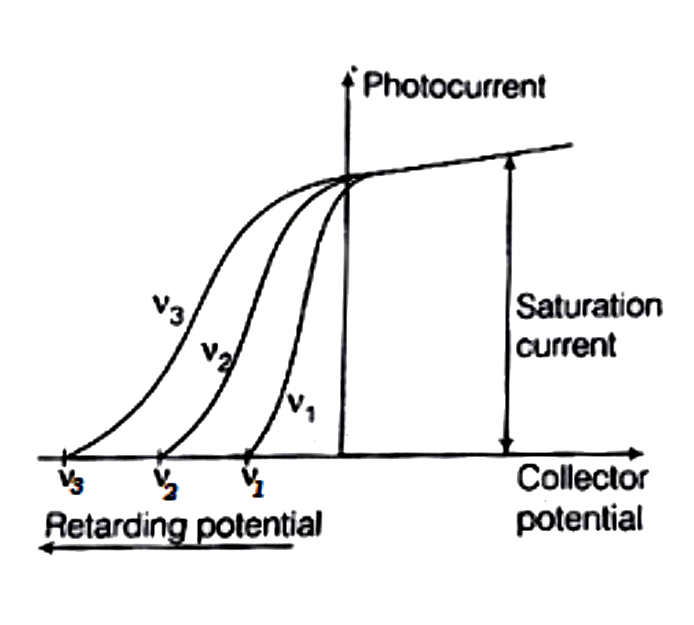
The variation of photo- current with collecttor potential for different frequencies of incident radiation v1, v2 and v3 is shown in the graph then

V1=V2=V3
V1>V2>V3
V1<V2<V3
V3=V1+V22
The correct Answer is:c
As eVs=Kmax=hv−ϕ0
Saturation current is same . It means each source of radiation has same intensity . But correcponding stopping has same intensity . But cooresponding stopping potential is different so they have different freqquencies .
So from eqn (i) and given graph we conclude that V1<V2<V3
Topper's Solved these Questions
Similar Questions
The variation of photocurrent with collector potential for different frequencies of incident radiation v1,v2,v3 is as shown in the the graph , then

View SolutionThe variation of photocurrent with collector potential for different frequencies of incident radiation v1,v2,v3 is as shown in the the graph , then

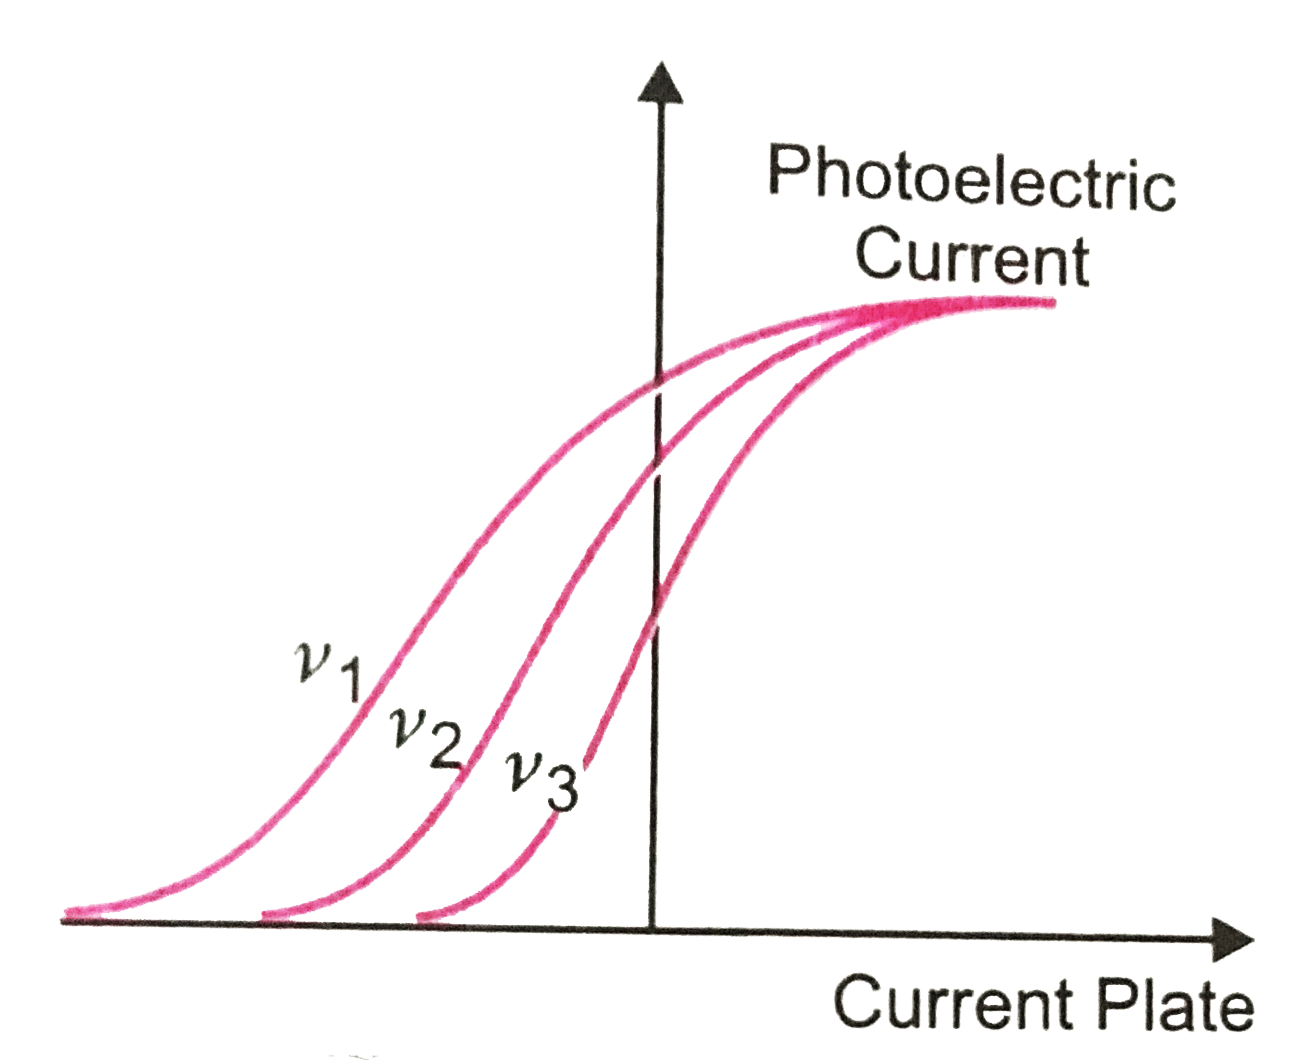
View SolutionThe graph of Fig. shows the variation of photoelectric current with collector plate potential for different frequencies of incident radiations.

(i) Which physical parameter is kept constant for the three curves?
(ii) Which frequency (v1,v2orv3) is the highest?
View SolutionDraw a plot showing the variation of photoelectric current with collector plate potential for two different frequencies, v1>v2, of incident radiation having the same intensity. In which case will the stopping potential be higher ? Justify your answer.
View SolutionDraw a plot showing the variation of photoelectric current with collector plate potential for two different frequenciesv1andv2(v1>v2) of incident radiation having the same intensity. In which case will the stopping potential be higher? Justify your answer.
View SolutionDraw suitable graphs to show the variation of photoelectric current with collector plate potential for
(i) a fixed frequency but different intensities I1>I2>I3 of radiation.
(ii) a fixed intensity but different frequencies v1>v2>v3 of radiation.
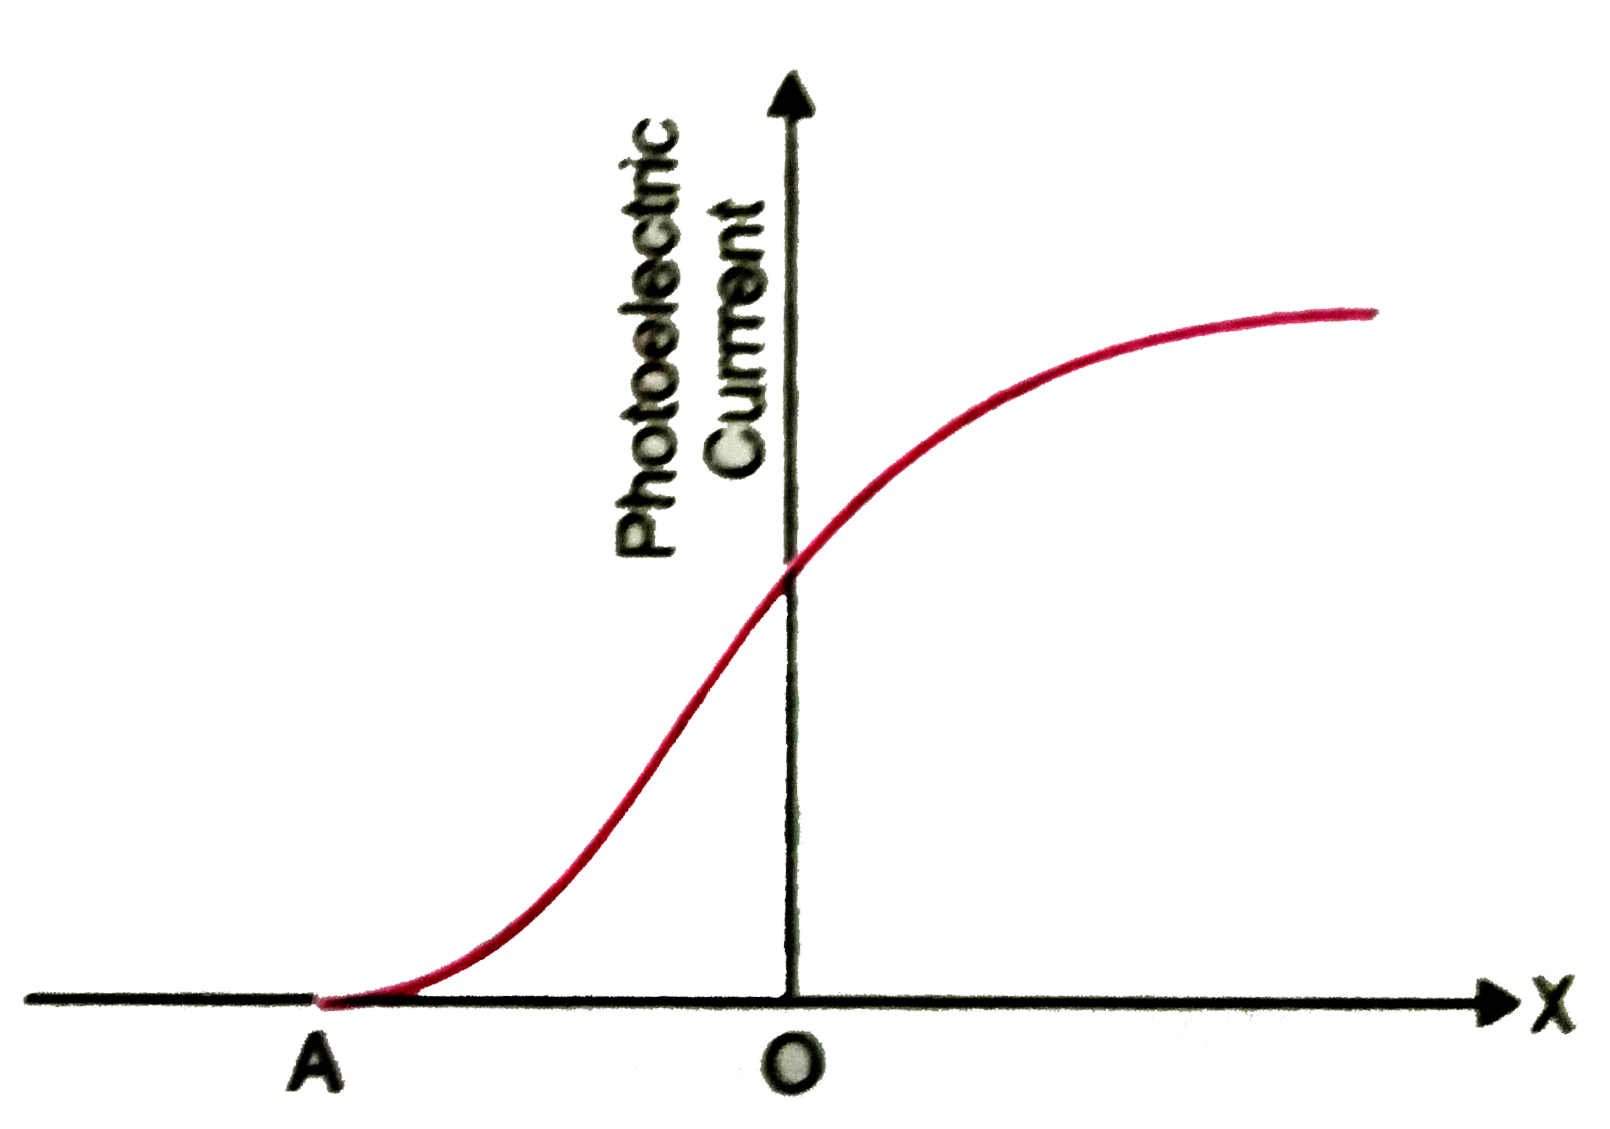
View SolutionThe following graph shows the variation of photoelectric current for a photosensitive metal .

(a) Identify the variable X on the horizontal line.
(b) What does the point A on the horizontal axis represent?
(c) Draw this graph for three different values of frequencies of incident radiation v1,v2andv3(v1>v2>v3) for same intensity.
(d) Draw this graph for three different values of intensities of incident radiation I1,I2,I3(I1>I2>I3) having same frequency.
View SolutionDraw graphs showing variation of photoelectric current with applied voltage for three incident radiations of equal frequency and different intensities. Mark the graph for the radiation of higher intensity.
View SolutionDarw graphs showing variation of photoelctric current with applied voltage for two incident radiations of equal frequecny and different intensities. Mark the graph for the radiaiton of higher intensity.
View Solution(i) Plot a labelled graph of |Vs| where Vs is stopping potential versus frequency f of the incident radiation.
(ii) State how will you use this graph to determine the value of Planck.s constant.
View Solution
