The variation of photocurrent with collector potential for different frequencies of incident radiation v1,v2,v3 is as shown in the the graph , then
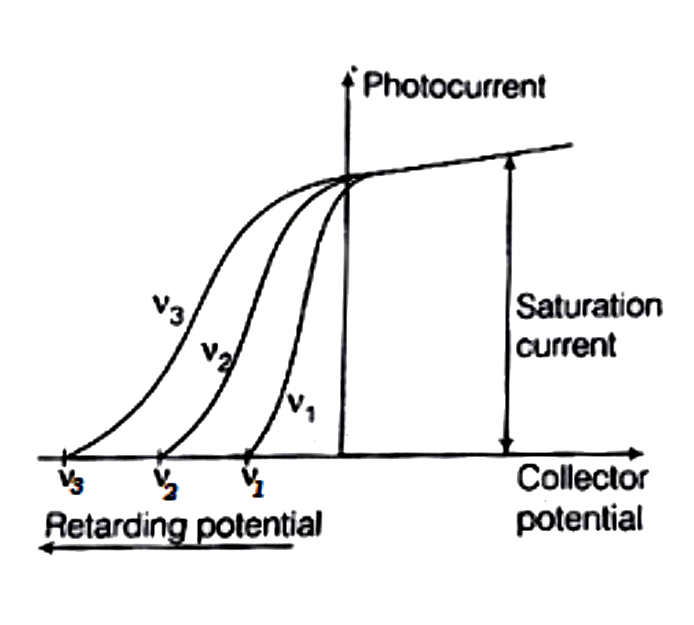
v1=v2=v3
v1>v2>v3
v1<v2<v3
v3=v1+v22
The correct Answer is:C
Step by step video & image solution for The variation of photocurrent with collector potential for different frequencies of incident radiation v_1,v_2,v_3 is as shown in the the graph , then by Physics experts to help you in doubts & scoring excellent marks in Class 12 exams.
Updated on:21/07/2023Similar Questions
Draw a plot showing the variation of photoelectric current with collector plate potential for two different frequencies, v1>v2 of incident radiation having the same intensity. In which case will the stopping potential be higher? Justify your answer.
View SolutionThe slope of the graph drawn between stopping potential and frequency of incident radiation will be
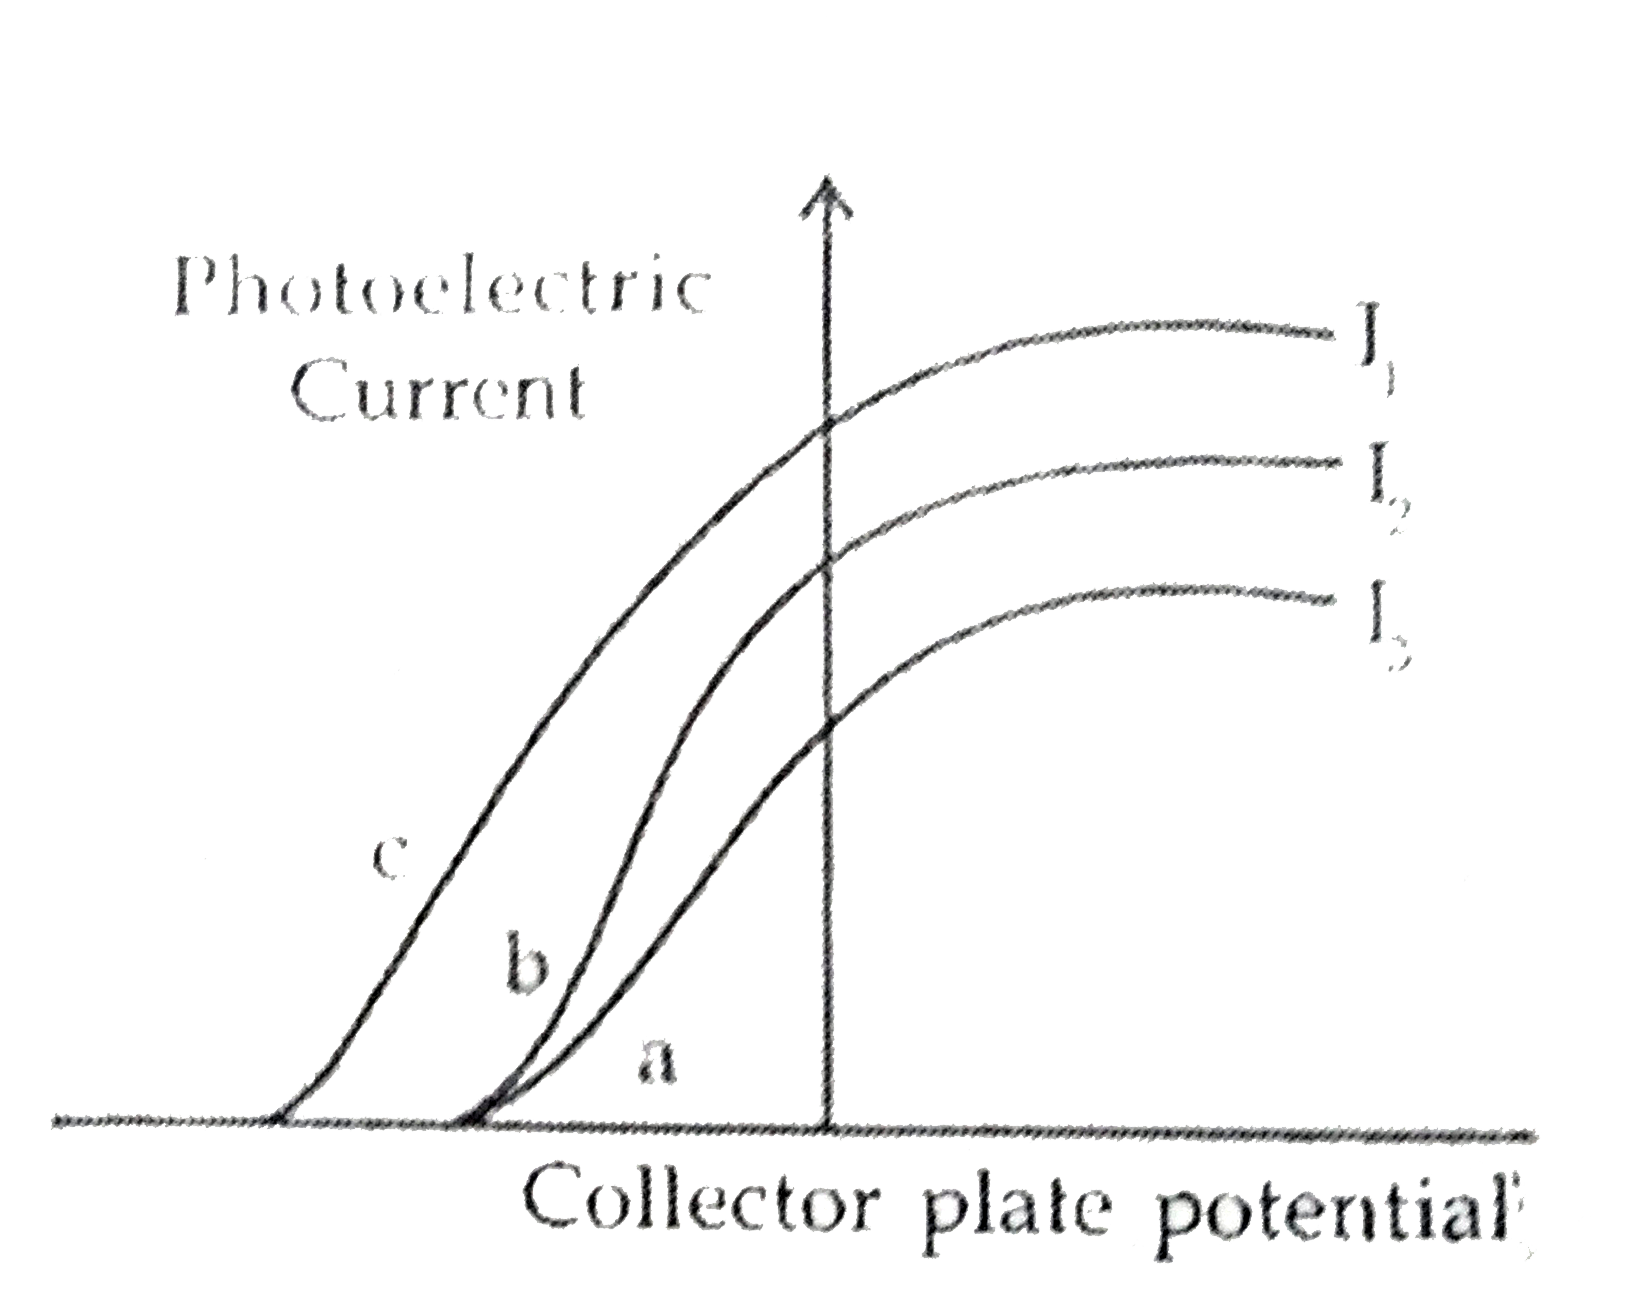
View SolutionThe figure shows a plot of three curves a, b, c, showing variation of photocurrent vs collector plate potential for three different intensities I1,I2andI3 having frequencies v1,v2andv3 respectively incident on a photosensitive surface.
Point out the two curves for which the incident radioations have same frequency but different intensities.
View SolutionWhat is the photoelectric effect? With the help of suitable graph show the variation of photocurrent with (i) the intensity of incident radiation. (ii) the voltage applied between cathode and anode. (iii) the frequency of incident radiation.
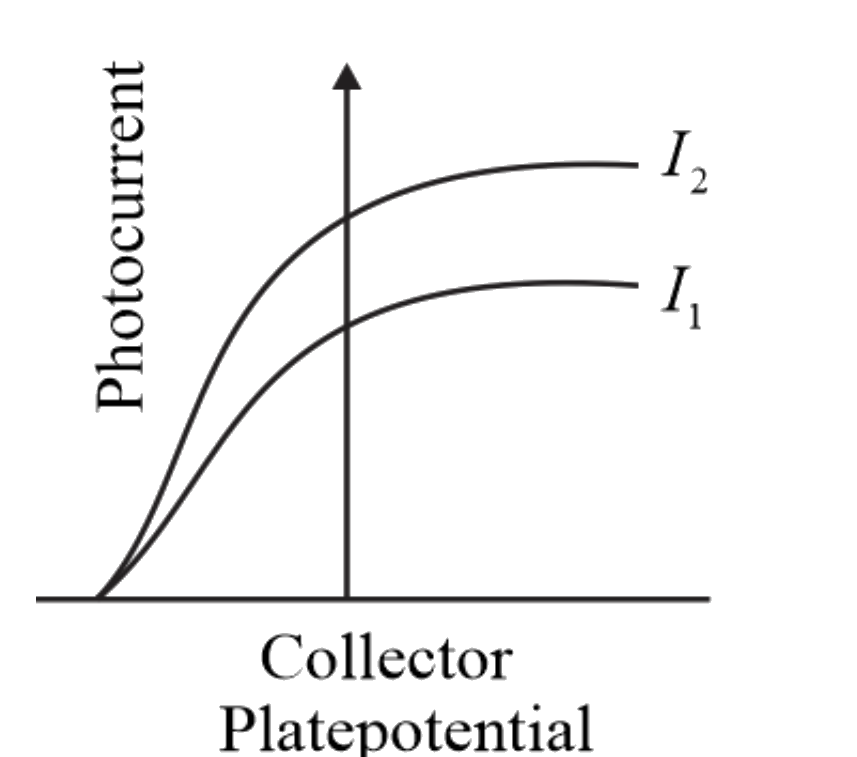
View SolutionFrom the following graph of photocurrent against collector plate potential for two different intensities of light I1andI2 one can , conclude
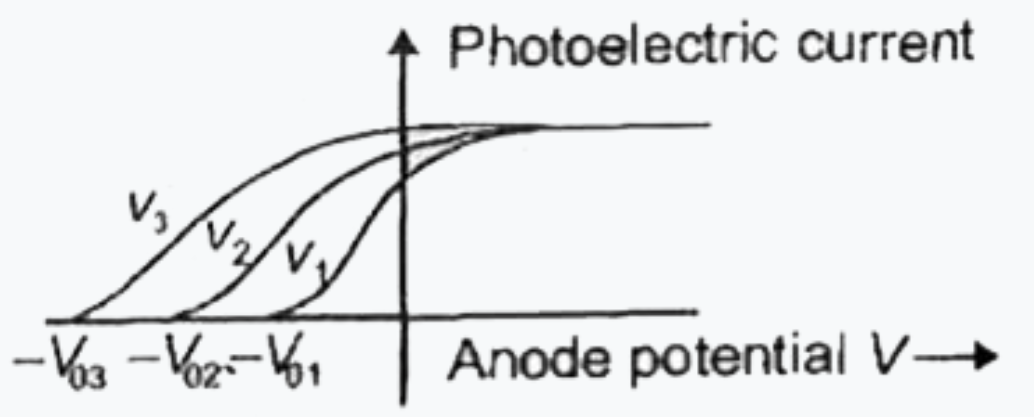
View SolutionIn photoelectric effect , the curve between photoelectric current and anode potential V (for different frequencies ) is shown in figure , then
View Solution(i) Plot a labelled graph of |Vs| where Vs is stopping potential versus frequency f of the incident radiation.
(ii) State how will you use this graph to determine the value of Planck.s constant.
View Solution(i) Plot a labelled graph of |Vs| where Vs is stopping potential versus frequency f of the incident radiation.
(ii) State how will you use this graph to determine the value of Planck.s constant.
View SolutionThe graph shows variation of stopping potential V0 versus frequency of incident radiation v for two photosensitive metals A and B. Which of two metals has higher threshold frequency and why?
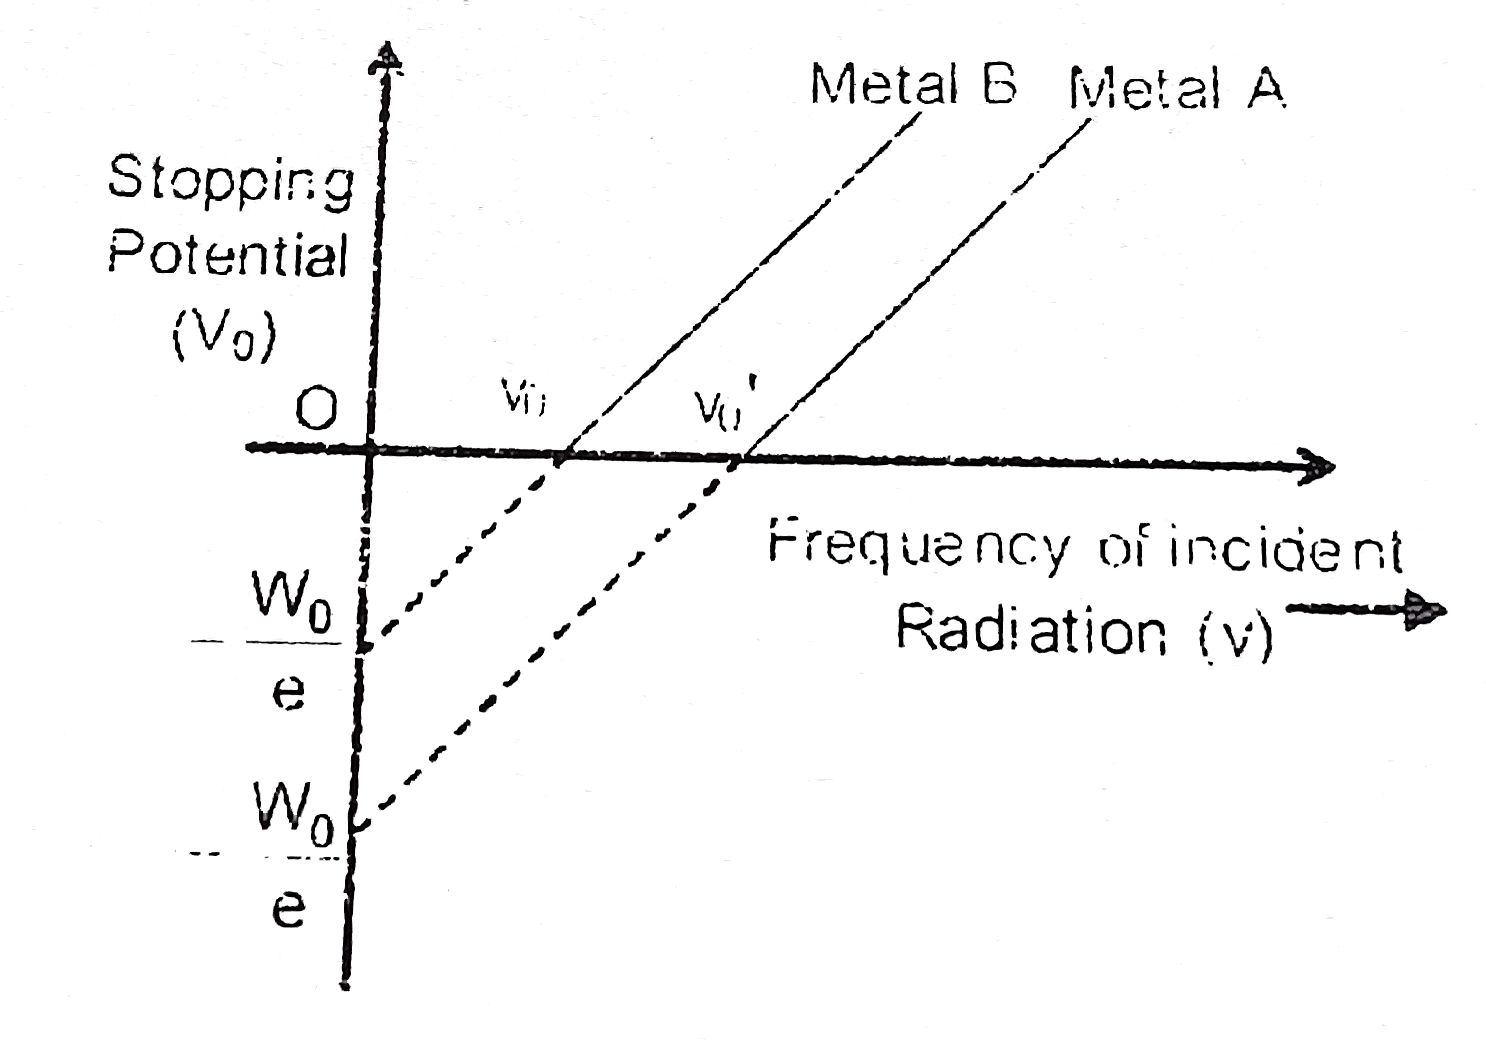
View SolutionSketch the graphs, showing the variation of stopping potential Vs with frequency v of the incident radiations for two photosensitive materials A and B having threshold frequencies v0>v'0 respectively.
(i) which of the two metals A or B has higher work function?
(ii) What information do you get from the slope of the graphs?
(iii) What does the value of the intercept of graph A on the potential axis represent?
View Solution
