Which of the following graphs correctly represents the relation between In (E) and In (T), where E is the amount of radiation emitted per unit time from a unit area of the body and T is the absolute temperature ?
A

B

C

D

Video Solution
Text Solution
The correct Answer is:C
We know
E=eT4
⇒ln E=ln e+4ln T
∴ ln e is negative
because e < 1

|
Updated on:21/07/2023
Topper's Solved these Questions
- BOOK - DISHA PUBLICATIONCHAPTER - THERMAL PROPERTIES OF MATTER EXERCISE - Exercise-2 (Concept Applicator)28videos
THERMAL PROPERTIES OF MATTER
- BOOK - DISHA PUBLICATIONCHAPTER - THERMAL PROPERTIES OF MATTER EXERCISE - Exercise-2 (Concept Applicator)28videos
THERMAL PROPERTIES OF MATTER
- BOOK - DISHA PUBLICATIONCHAPTER - SYSTEM OF PARTICLES & ROTATIONAL MOTION EXERCISE - EXERCISE-2 : CONCEPT APPLICATOR28videos
SYSTEM OF PARTICLES & ROTATIONAL MOTION
- BOOK - DISHA PUBLICATIONCHAPTER - THERMODYNAMICS EXERCISE - EXERCISE -2 : CONCEPT APPLICATOR29videos
THERMODYNAMICS
Similar Questions
Knowledge Check
- Question 1 - Select One
The amount of heat enerrgy radiated per unit time per unit area by a body depends upon
Aarea of the bodyBtemperature and nature of the bodyCnature of the body onlyDall of these - Question 2 - Select One
Which one of the following correctly represents the variation between linear momentum (P) and kinetic energy (E) ofa body?
A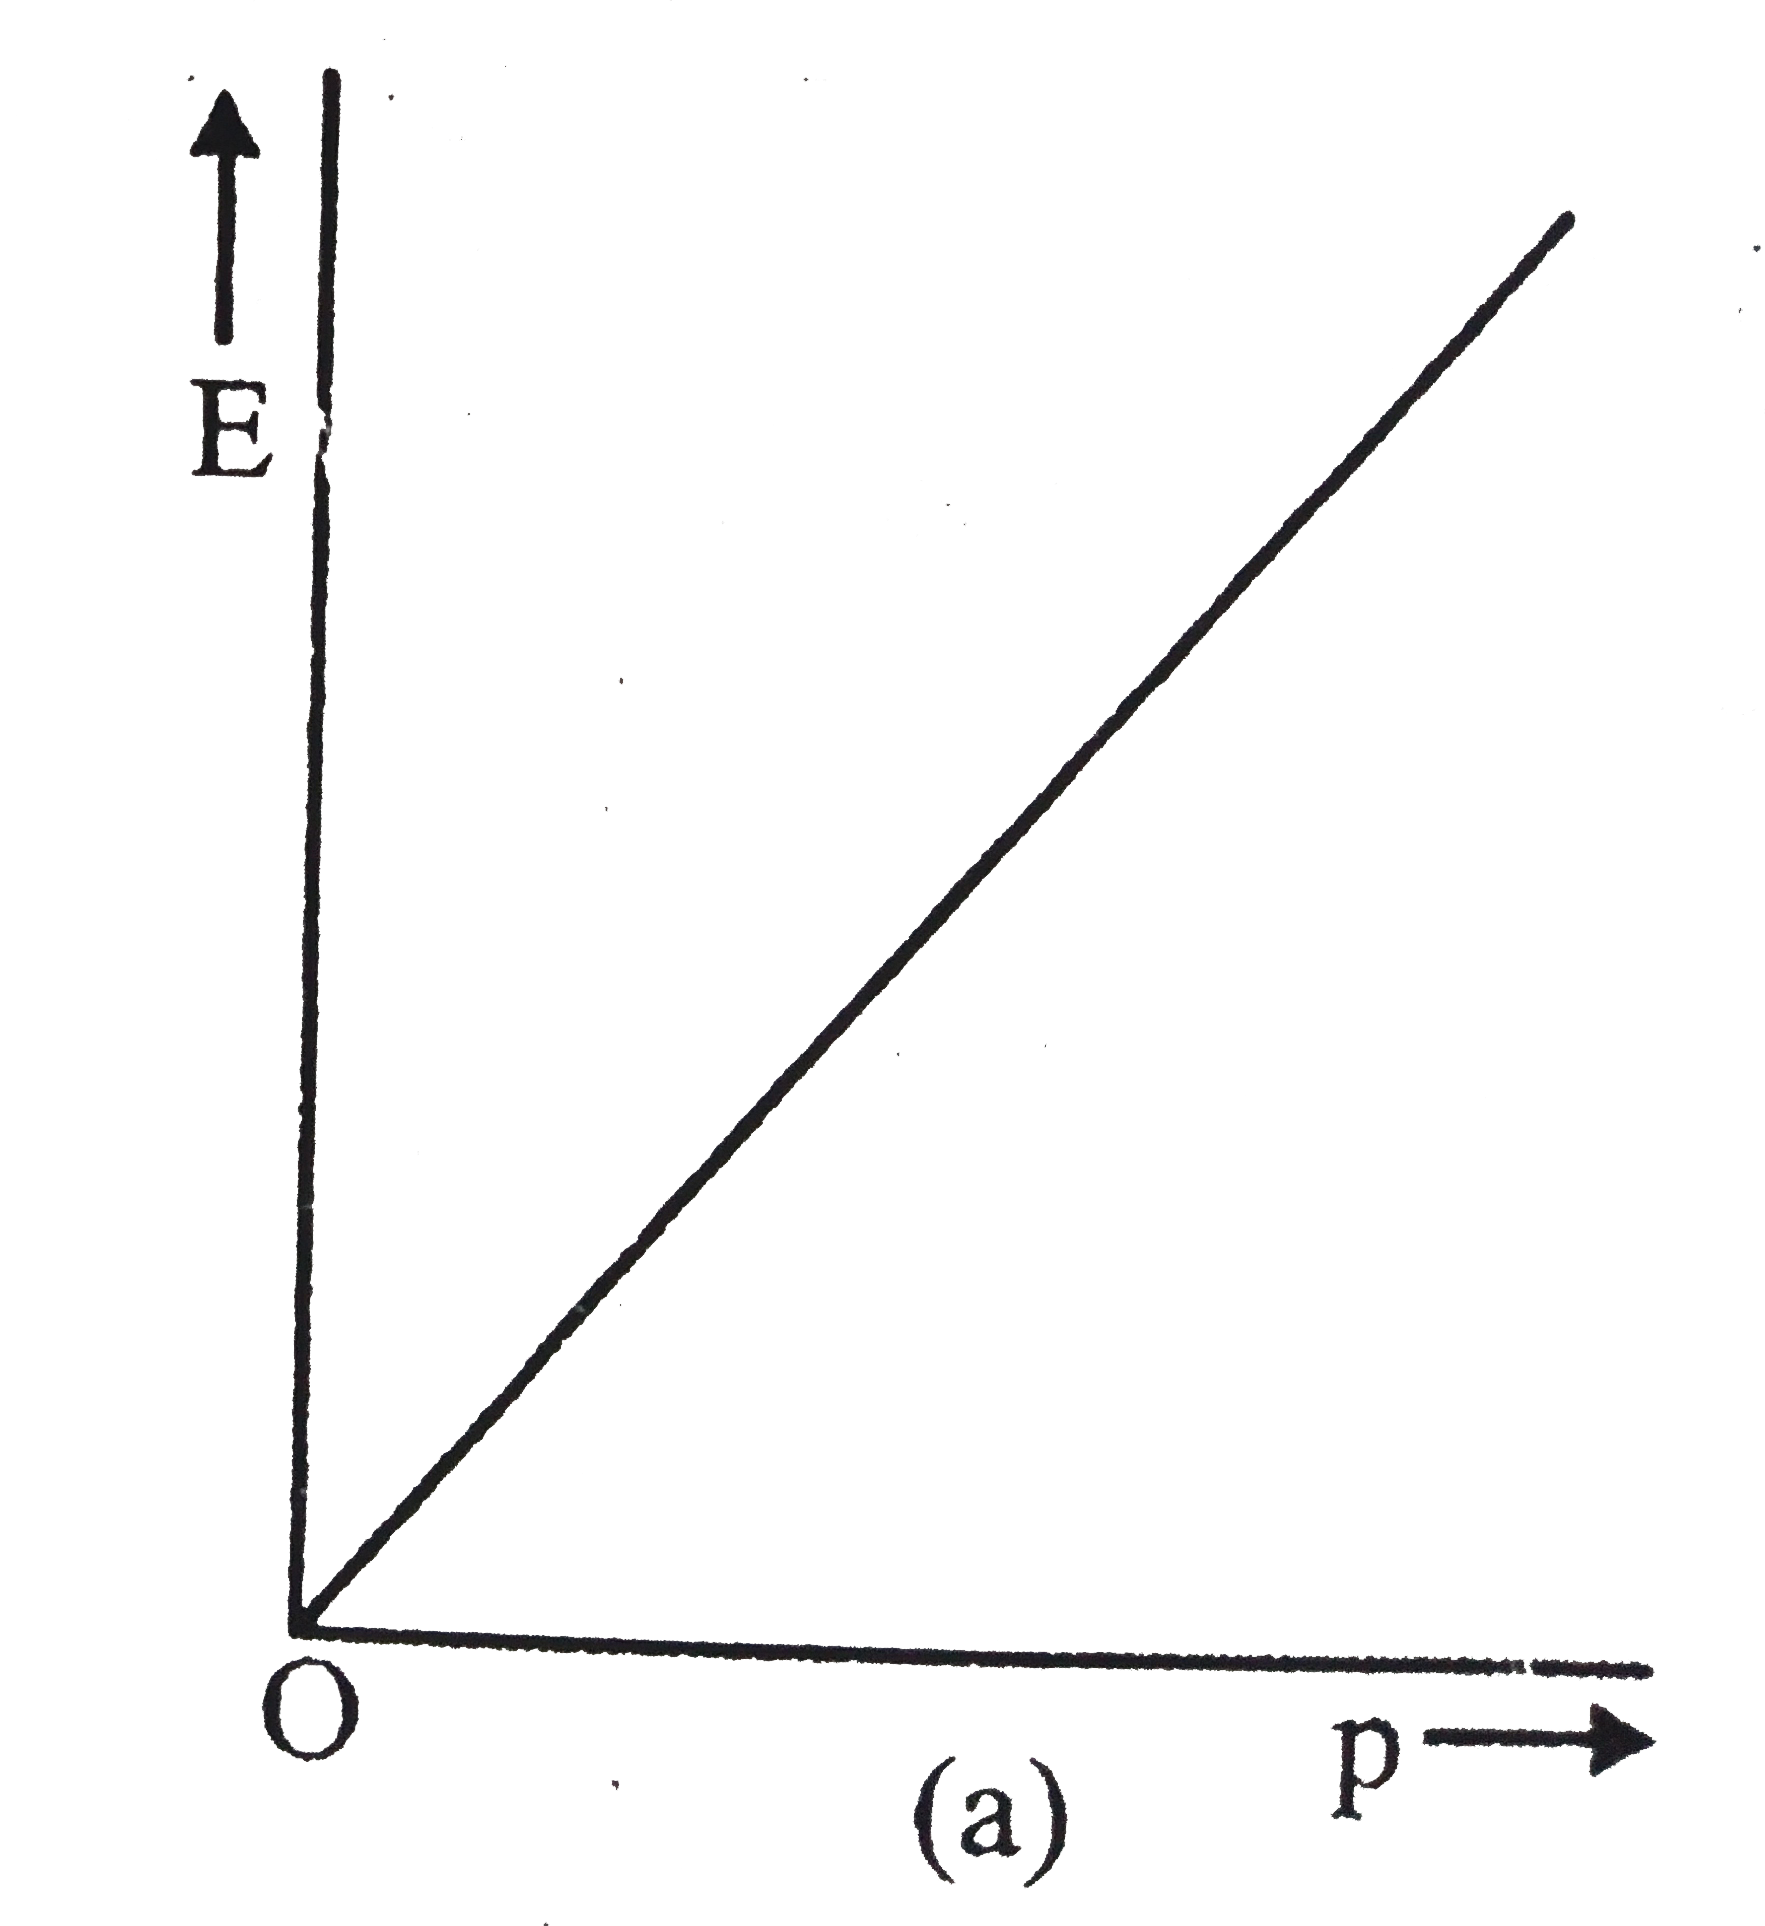 B
B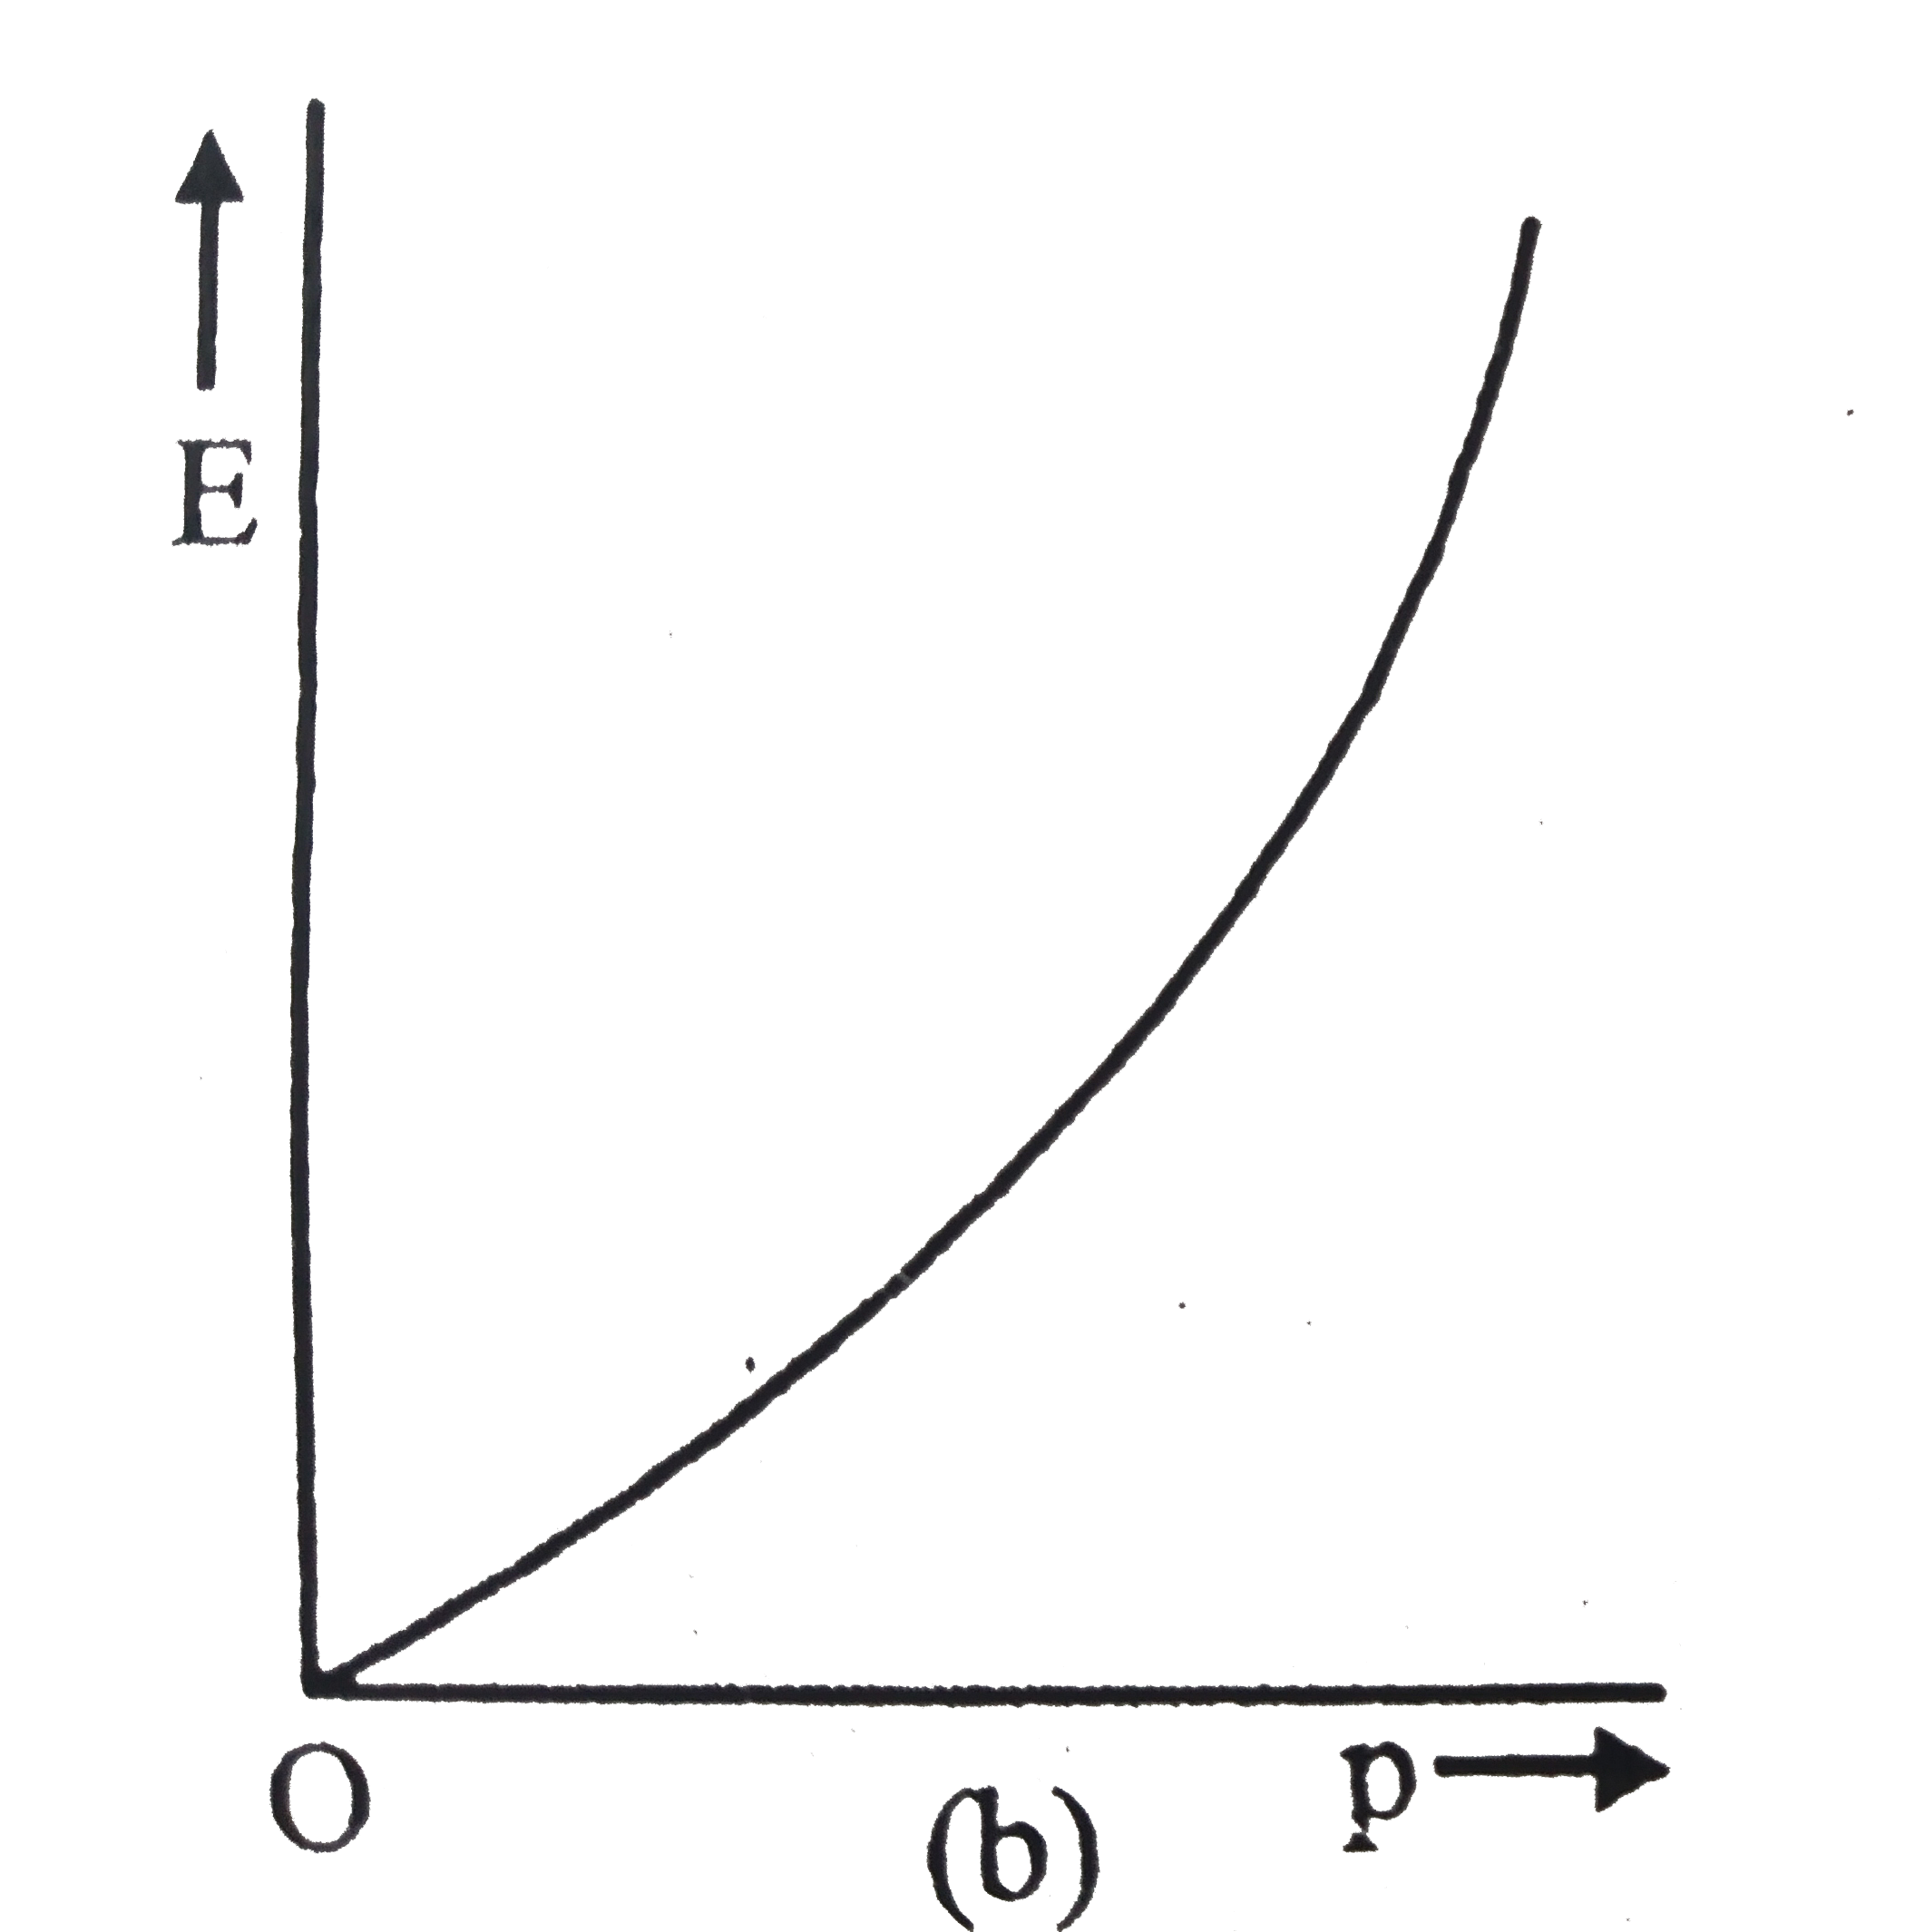 C
C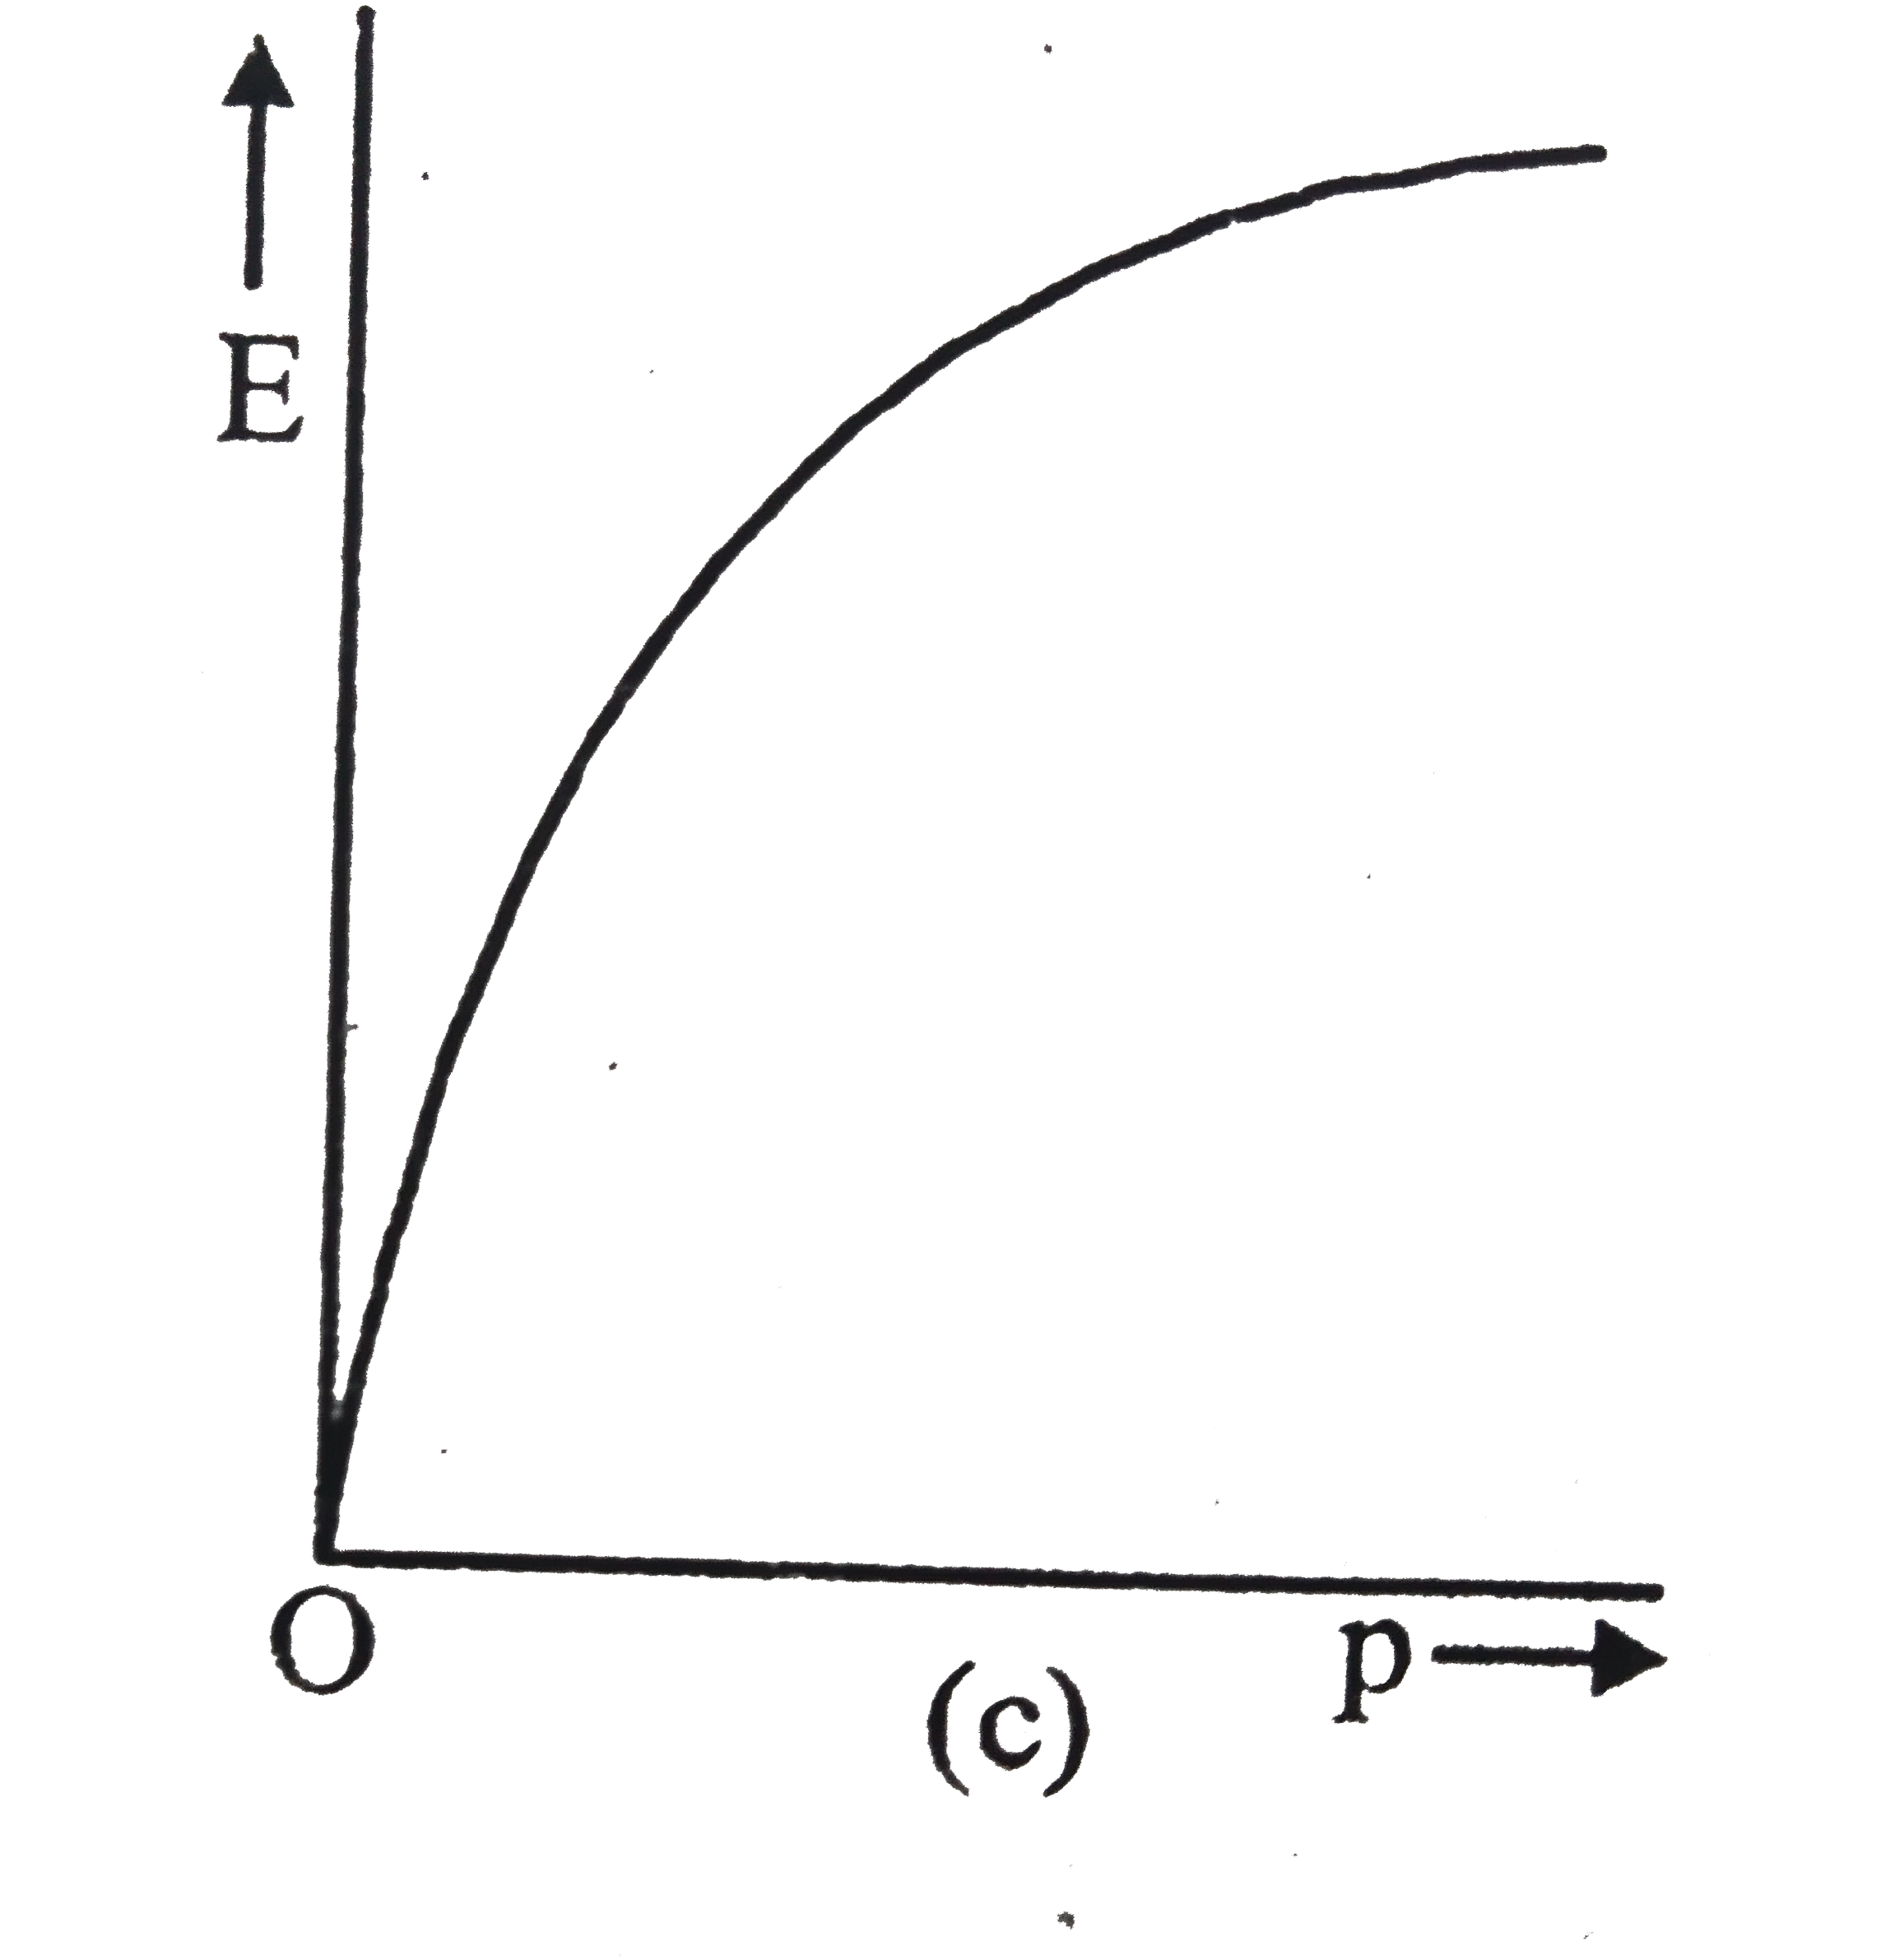 D
D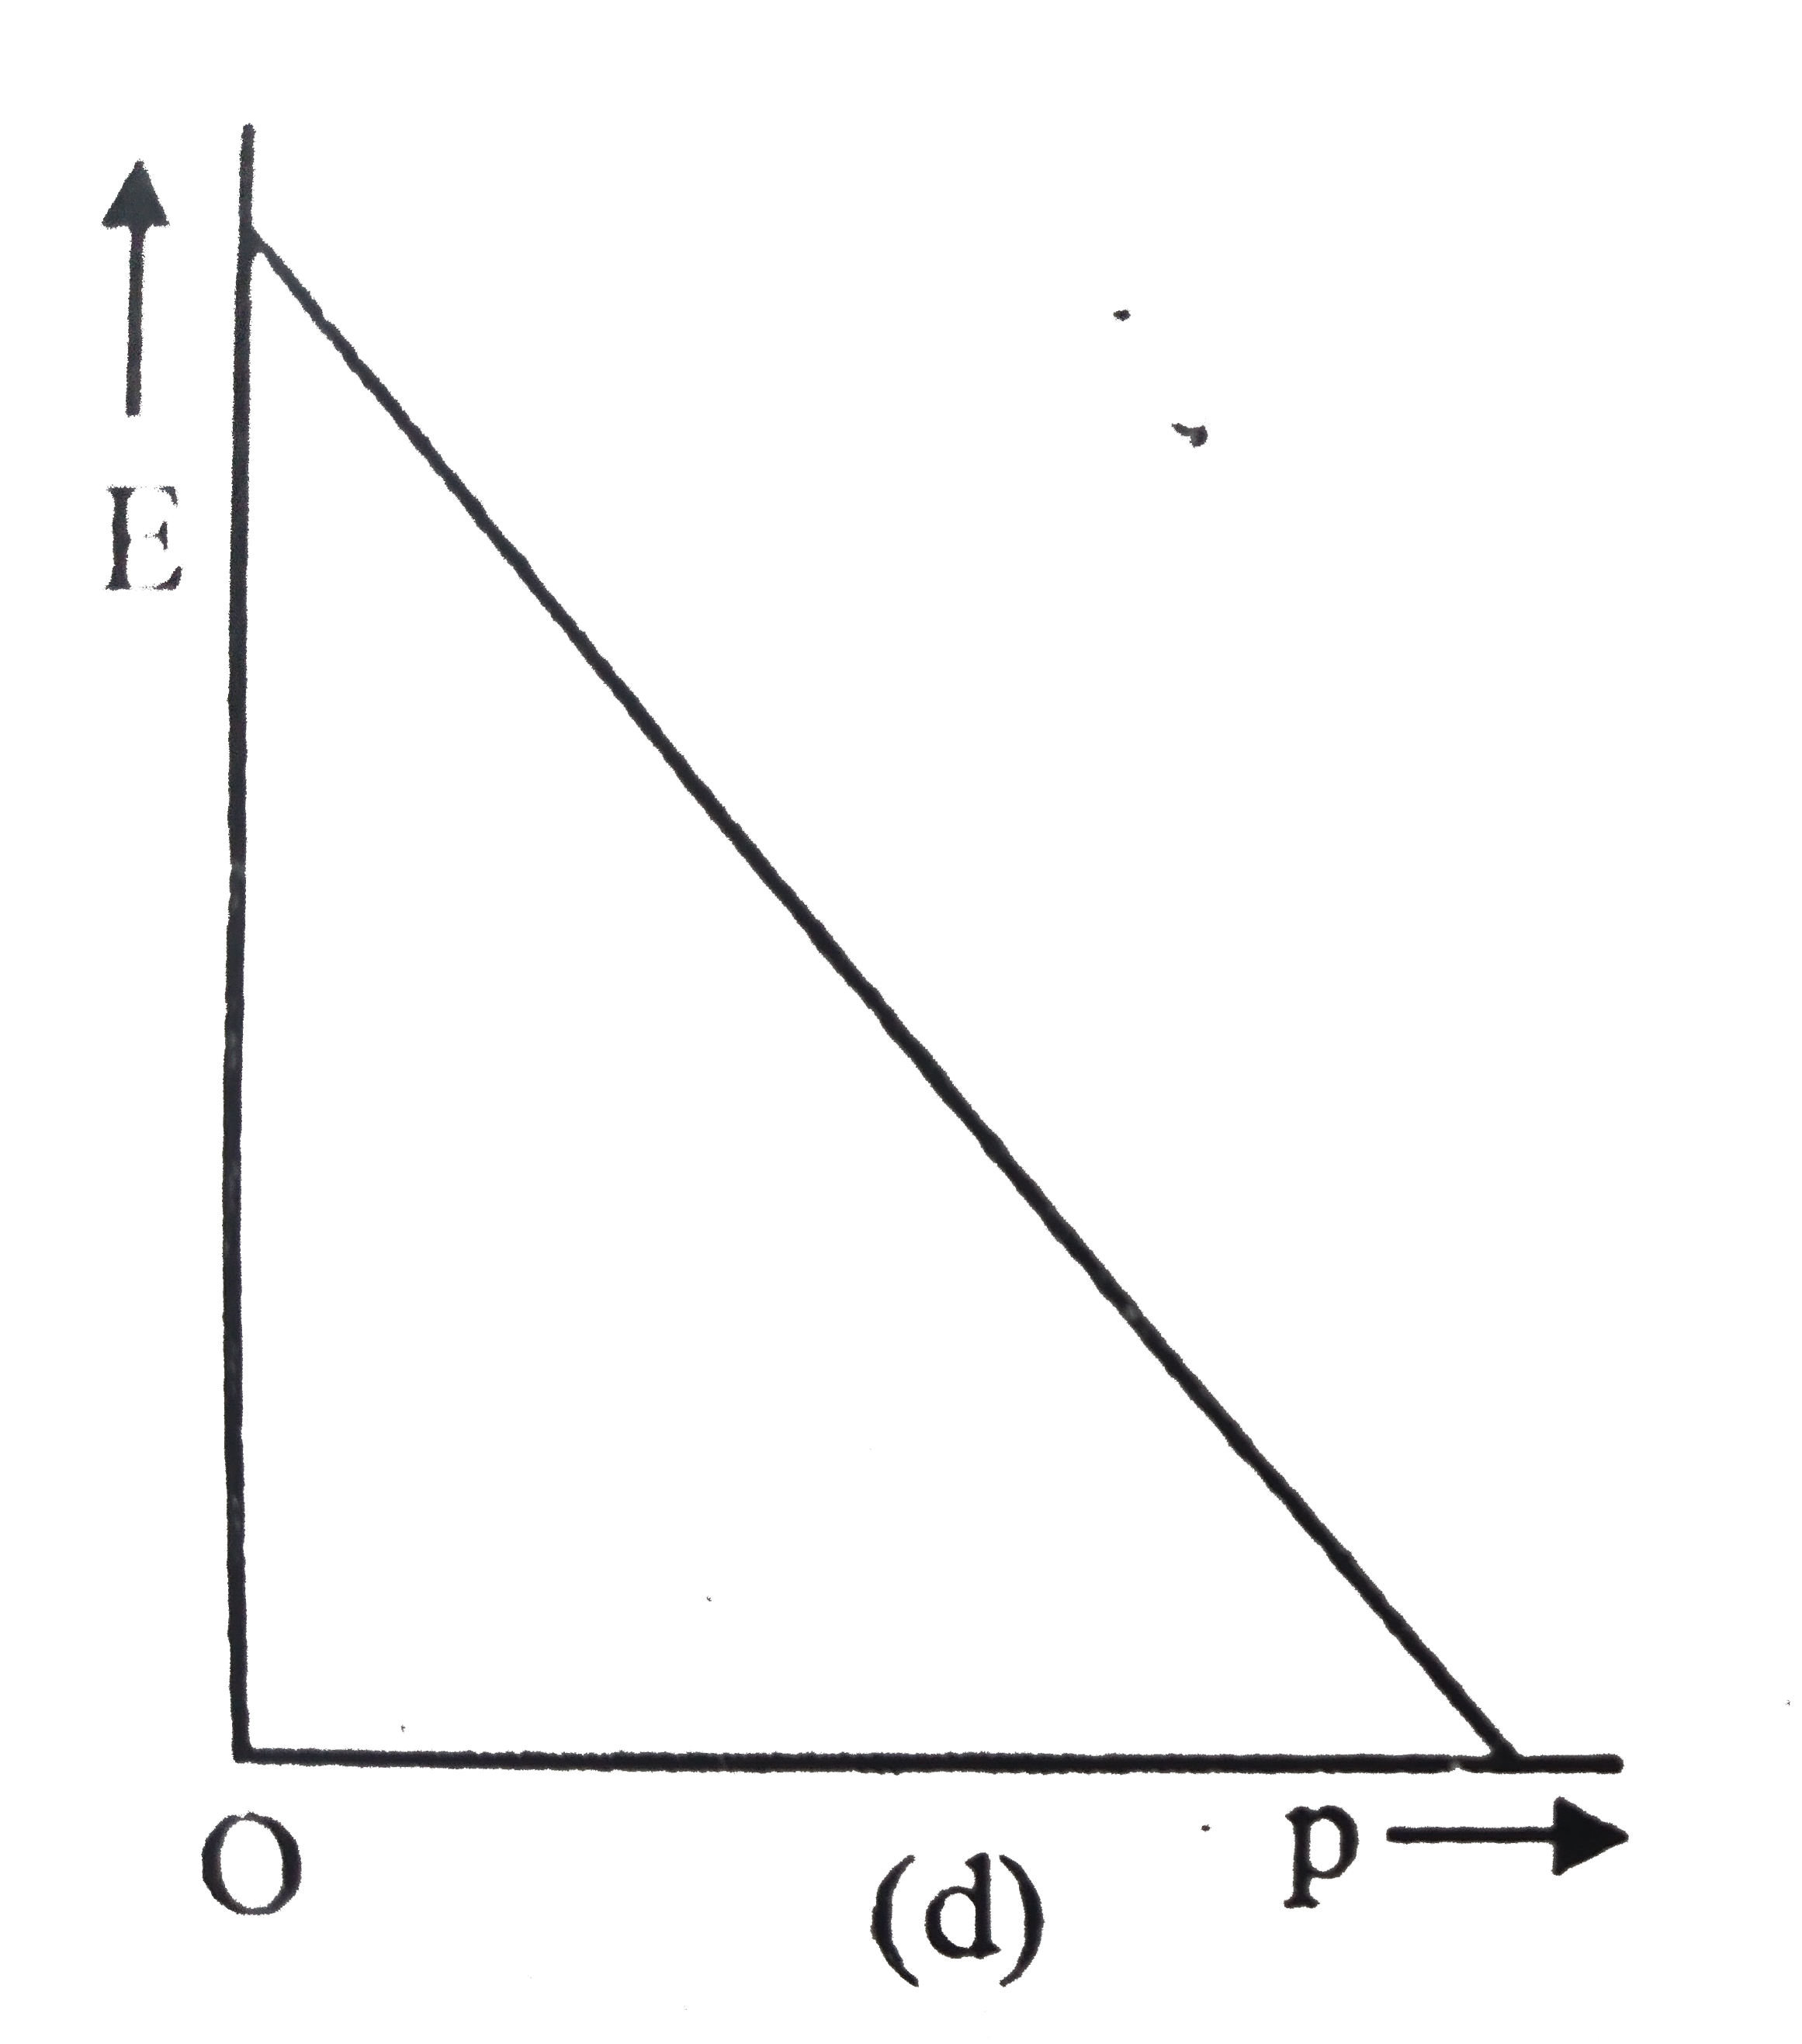
- Question 3 - Select One
which of the following graphs correctly represents the vatiation β=−(dVdP)T/V with P for an ideal gas at constant temperature ? .
A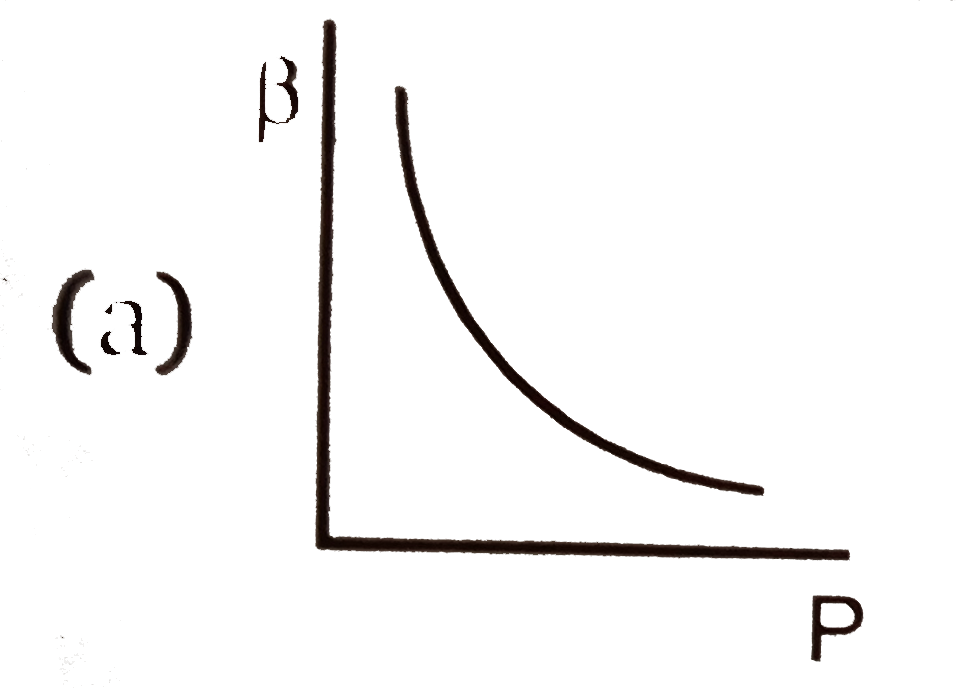 B
B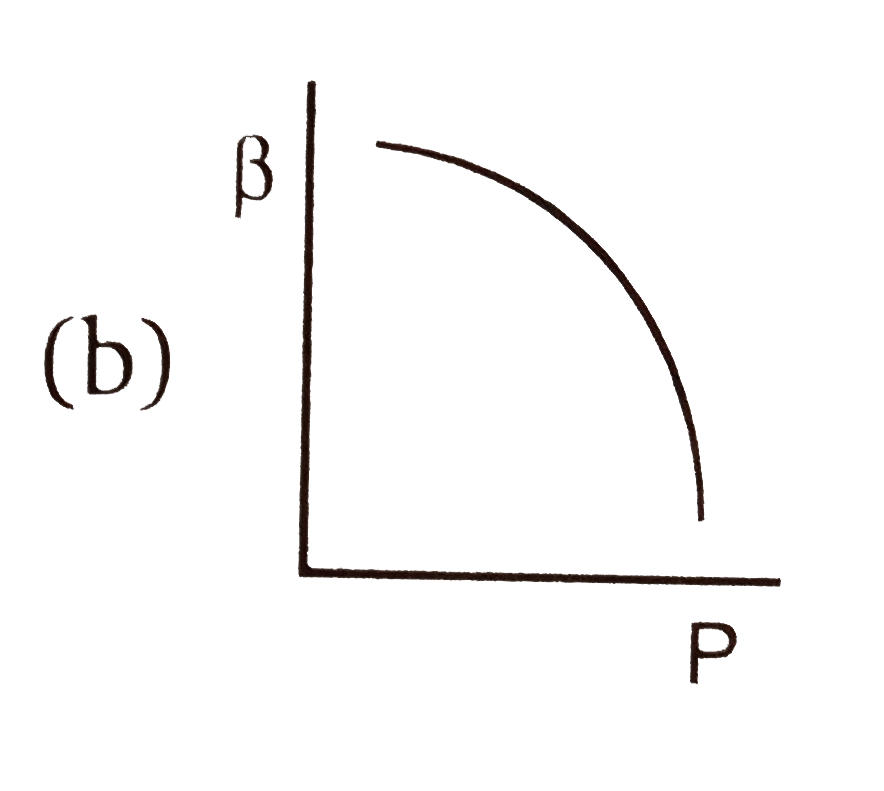 C
C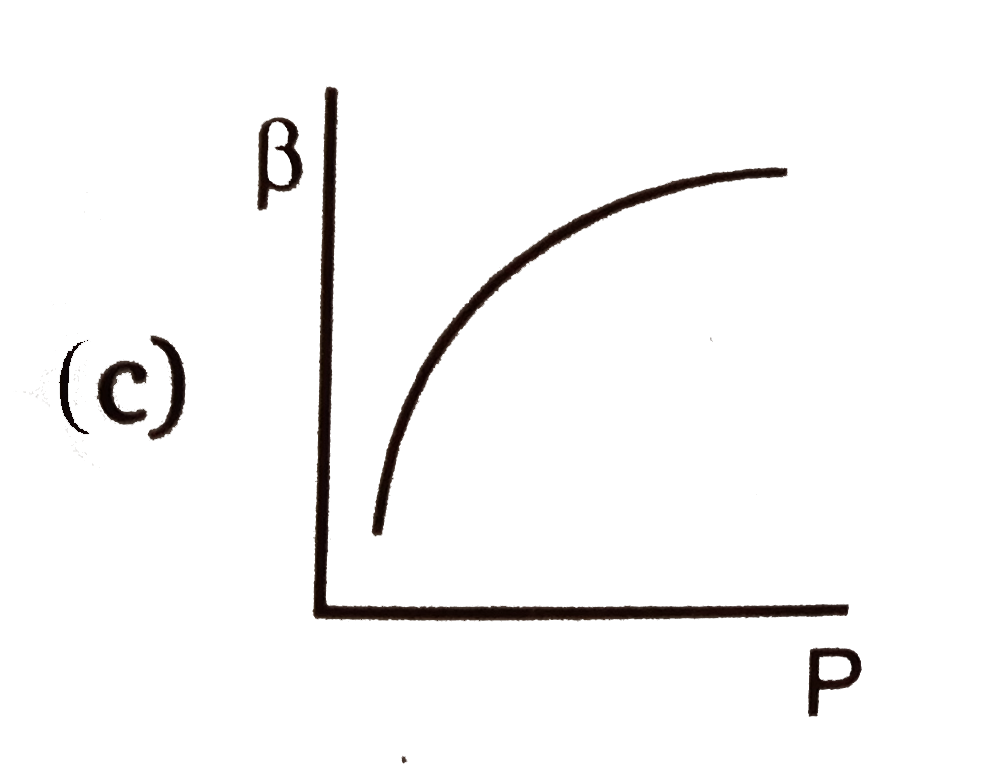 D
D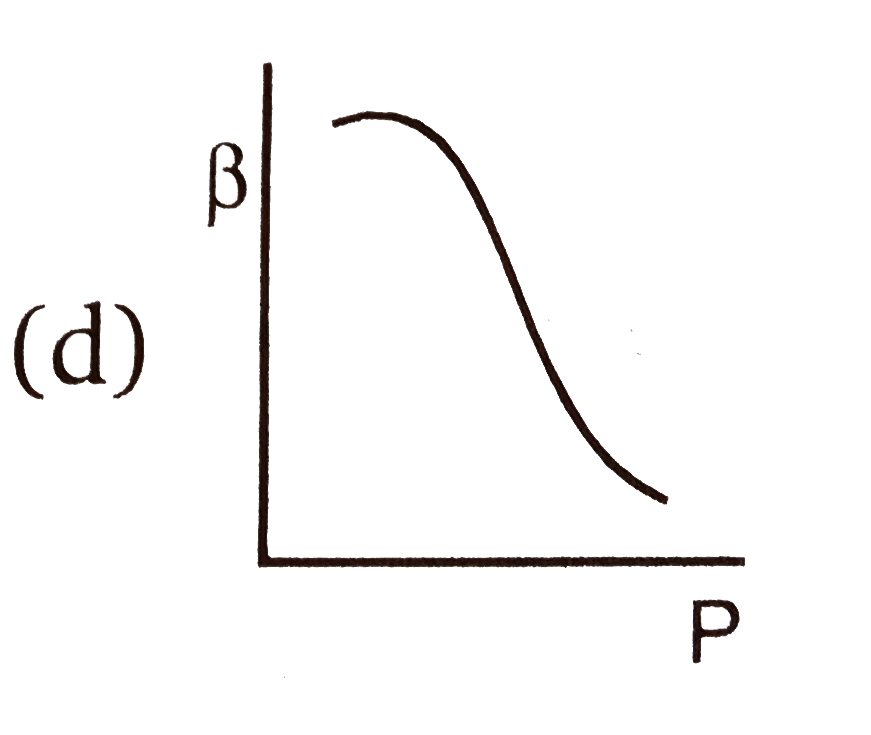
The amount of radiations emitted per second by unit area of a hollow container at 103∘ K will be-
View Solutionwhich of the following graph represents the variation of resistivity (ρ) with temperature (T) for copper?
View SolutionWhich of following graphs correctly represent variation of α=−(dV/dP)TV with P for fixed amount of an ideal gas at constant temperature ?
View SolutionWhich of the following graphs represents the variation of activity (A) of a radioactive substance with time (t).
View SolutionThe amount of thermal radiations emitted from one square metre area of a black body in one second when at a temperature of 100 K is
View Solution
