which of the following graph represents the variation of resistivity (ρ) with temperature (T) for copper?
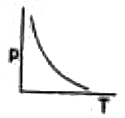
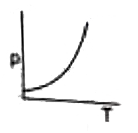

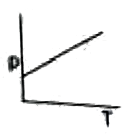
In case of copper, resistivity is nearly proportional to temperature although a non linear region always exists very low temperature.
Topper's Solved these Questions
- BOOK - PHYSICS WALLAHCHAPTER - CURRENT ELECTRICITYEXERCISE - Level-230videos
CURRENT ELECTRICITY
- BOOK - PHYSICS WALLAHCHAPTER - ALTERNATING CURRENT EXERCISE - NEET PAST 5 YEARS QUESTIONS8videos
ALTERNATING CURRENT
- BOOK - PHYSICS WALLAHCHAPTER - DUAL NATURE OF RADIATION AND MATTEREXERCISE - Neet past 5 years questions16videos
DUAL NATURE OF RADIATION AND MATTER
Similar Questions
Which one of the following given graphs represents the variation of rate constant (k) with temperature (t) for an endothermic reaction ?
View SolutionWhich one of the following given graphs represents the variation of rate constant (k) with temperature (f) for an endothermic reaction ?
View Solution
Knowledge Check
- Question 1 - Select One
which of the following graph represents the variation of resistivity (ρ) with temperature (T) for copper?
A B
B C
C D
D
- Question 2 - Select One
Arrhenius equation is :
k=Ae−E/RT
Which of the following graphs represents the variation of rate constant k against temperatureT ?A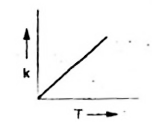 B
B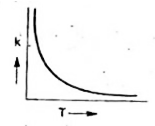 C
C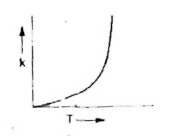 D
D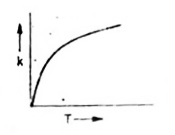
- Question 3 - Select One
Which of the following graphs represents ohmic resistance?
A B
B C
C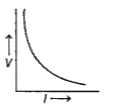 D
D
Show variation of resistivity of SI with temperature in a graph.
View SolutionArrehnius equation is :
k=Ae−Ea/RT
Which of the following graphs represents the variation of rate constant k against temerature T?View SolutionWhich one of the following graphs represents the variation of surface tension of water with temperture for a small range of temperature ?
View SolutionWhich of the following curve represent variation of density of water with temperature best-
View SolutionWhich one of the following graphs represents variation of specific heat capacity of water with temperature?
View Solution

