The table given below represents the cost, revenue and tax rate for XYZ Limited for a period of 8 years. Cost and revenue are given in Rs. '000 crores.
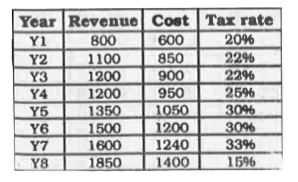
Profit for any year = revenue-cost
Profit after tax for any year = profit of that year - tax of that year
Tax on any year = tax rate of that year x profit of the year
How much tax (in Rs '000 croses) was paid by XYZ limited in Y7 ?
90
99
118.8
126
The correct Answer is:C
Step by step video & image solution for The table given below represents the cost, revenue and tax rate for XYZ Limited for a period of 8 years. Cost and revenue are given in Rs. '000 crores. Profit for any year = revenue-cost Profit after tax for any year = profit of that year - tax of that year Tax on any year = tax rate of that year x profit of the year How much tax (in Rs '000 croses) was paid by XYZ limited in Y7 ? by Maths experts to help you in doubts & scoring excellent marks in Class 14 exams.
Updated on:21/07/2023Similar Questions
The table given below represents the cost, revenue and tax rate for XYZ Limited for a period of 8 years. Cost and revenue are given in Rs. '000 crores.
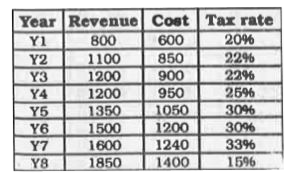
Profit for any year = revenue-cost
Profit after tax for any year = profit of that year - tax of that year
Tax on any year = tax rate of that year x profit of the year
How many distinct values of yearly profit are there ?
View SolutionThe table given below represents the cost, revenue and tax rate for XYZ Limited for a period of 8 years. Cost and revenue are given in Rs. '000 crores.
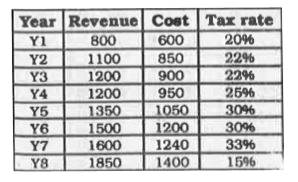
Profit for any year = revenue-cost
Profit after tax for any year = profit of that year - tax of that year
Tax on any year = tax rate of that year x profit of the year
What is the total sum (in '000 crores) of profit after tax for Y1 to Y8 ?
View Solution
Knowledge Check
The table given below represents the cost, revenue and tax rate for XYZ Limited for a period of 8 years. Cost and revenue are given in Rs. '000 crores.

Profit for any year = revenue-cost
Profit after tax for any year = profit of that year - tax of that year
Tax on any year = tax rate of that year x profit of the year
How much tax (in Rs '000 croses) was paid by XYZ limited in Y7 ?A90B99C118.8D126The table given below represents the cost, revenue and tax rate for XYZ Limited for a period of 8 years. Cost and revenue are given in Rs. '000 crores.

Profit for any year = revenue-cost
Profit after tax for any year = profit of that year - tax of that year
Tax on any year = tax rate of that year x profit of the year
What is the total sum (in '000 crores) of profit after tax for Y1 to Y8 ?A1763.6B1803.2C1820.2D1872.4The table given below represents the cost, revenue and tax rate for XYZ Limited for a period of 8 years. Cost and revenue are given in Rs. '000 crores.

Profit for any year = revenue-cost
Profit after tax for any year = profit of that year - tax of that year
Tax on any year = tax rate of that year x profit of the year
How much tax (in Rs '000 croses) was paid by XYZ limited in Y7 ?A3B4C5D6
The table given below represents the cost, revenue and tax rate for XYZ Limited for a period of 8 years. Cost and revenue are given in Rs. '000 crores.

Profit for any year = revenue-cost
Profit after tax for any year = profit of that year - tax of that year
Tax on any year = tax rate of that year x profit of the year
Which of the following is correct about profit after tax for years Y2, Y6 and Y8 ?
View SolutionThe table given below represents the cost, revenue and tax rate for XYZ Limited for a period of 8 years. Cost and revenue are given in Rs. '000 crores.

Profit for any year = revenue-cost
Profit after tax for any year = profit of that year - tax of that year
Tax on any year = tax rate of that year x profit of the year
How much tax (in Rs '000 croses) was paid by XYZ limited in Y7 ?
View SolutionThe bar graph given below represents the revenue of a firm for 8 years. All the revenue figures have been shown in terms of Rs. crores.
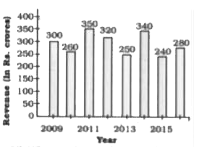
In how many years, the revenue of the firm is less than the average revenue for these 8 years ?
View SolutionThe bar graph given below represents the revenue of a firm for 8 years. All the revenue figures have been shown in terms of Rs. crores.
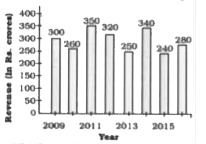
In which year the firm has shown maximum percentage with respect to the previous year ?
View SolutionThe bar graph given below represents the revenue of a firm for 8 years. All the revenue figures have been shown in terms of Rs. crores.
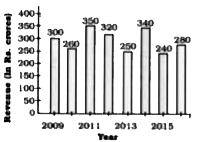
What is the total value of revenue of the firm (in Rs. crores) in years 2010, 2011 and 2012?
View Solution
