The bar graph given below represents the revenue of a firm for 8 years. All the revenue figures have been shown in terms of Rs. crores.
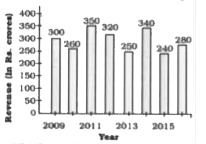
In which year the firm has shown maximum percentage with respect to the previous year ?
a)2011
b)2014
c)2016
d)All are equal
The correct Answer is:B
Step by step video, text & image solution for The bar graph given below represents the revenue of a firm for 8 years. All the revenue figures have been shown in terms of Rs. crores. In which year the firm has shown maximum percentage with respect to the previous year ? by Maths experts to help you in doubts & scoring excellent marks in Class 14 exams.
Updated on:21/07/2023Topper's Solved these Questions
- STATISTICS AND DATA INTERPRETATIONBOOK - KIRAN PUBLICATIONCHAPTER - STATISTICS AND DATA INTERPRETATIONEXERCISE - TYPE-III
39 Videos
- STATISTICS AND DATA INTERPRETATIONBOOK - KIRAN PUBLICATIONCHAPTER - STATISTICS AND DATA INTERPRETATIONEXERCISE - TYPE-IV
182 Videos
- STATISTICS AND DATA INTERPRETATIONBOOK - KIRAN PUBLICATIONCHAPTER - STATISTICS AND DATA INTERPRETATIONEXERCISE - TYPE-VIII
8 Videos
- SIMPLIFICATIONBOOK - KIRAN PUBLICATIONCHAPTER - SIMPLIFICATIONEXERCISE - TEST YOURSELF
25 Videos
- TIME AND DISTANCEBOOK - KIRAN PUBLICATIONCHAPTER - TIME AND DISTANCEEXERCISE - Type -XI
74 Videos
Similar Questions
Read the bar graph given below and answer the following questions:
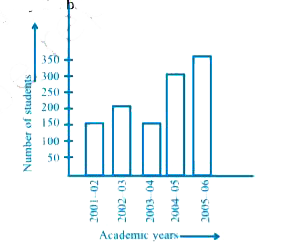
In which year is the increase in number of students maximum as compared to the previous year?
View SolutionThe bar graph given below represents the revenue of a firm for 8 years. All the revenue figures have been shown in terms of Rs. crores.
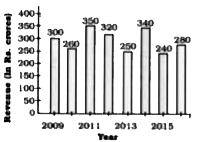
What is the total value of revenue of the firm (in Rs. crores) in years 2010, 2011 and 2012?
View Solution
Knowledge Check
The bar graph given below represents the revenue of a firm for 8 years. All the revenue figures have been shown in terms of Rs. crores.
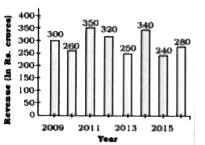
By what percentage has the revenue of the firm decreased in 2010 with respect to the last year ?A15.38B14.44C11.11D13.33The bar graph given below represents the revenue of a firm for 8 years. All the revenue figures have been shown in terms of Rs. crores.
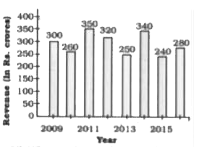
In how many years, the revenue of the firm is less than the average revenue for these 8 years ?A3B4C5D6In which year the firm has shown maximum percentage increase in its revenue with respect to the previous year?
A2011B2014C2016DAll are equal
Solve the following questions on the basis of given data in the following table :
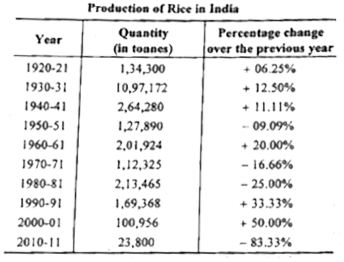
Out of the given years which year has shown least increase (in amount) over the previous year :
View SolutionIn how many years, the revenue of the firm is less than the average revenue for these 8 years?
View SolutionStudy the following bar graph and answer the question that follows.
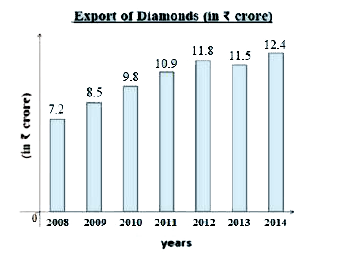
In which year was the maximum percentage increase in diamond exports compared to the previous year?
View SolutionThe following table shows the annual profit of a company (in Rs. lakh).

The period which has the maximum percentage increase in profit over the previous year is:
View SolutionStudy the following graph carefully and answer the questions given below it -----
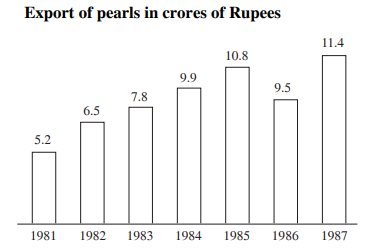
In which year there was maximum percentage increase in export of pearls to that in the previous year ?
View Solution
